Open Access
Fig. 3.
Download original image
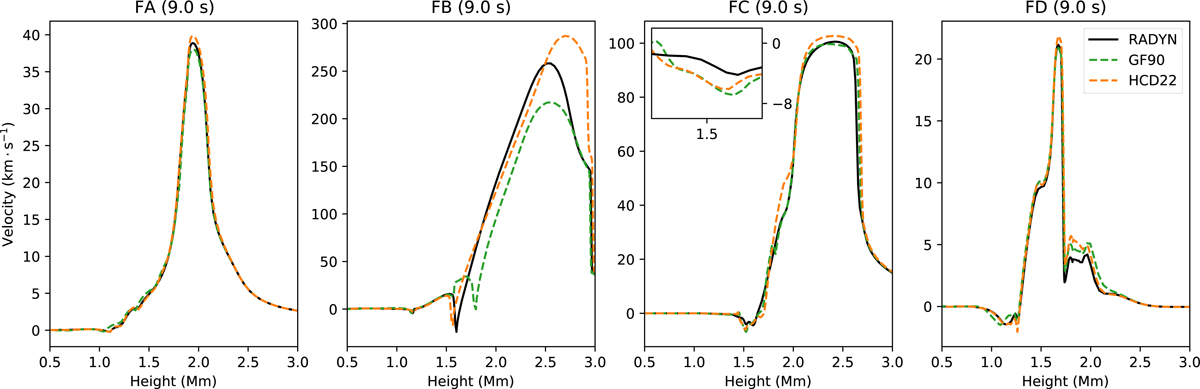
Height distributions of velocity for four cases at 9.0 s. Positive velocity values denote upward motions, while negative velocity values denote downward motions. The black, green, and orange lines represent the results of RADYN, GF90, and HCD22 recipes, respectively.
Current usage metrics show cumulative count of Article Views (full-text article views including HTML views, PDF and ePub downloads, according to the available data) and Abstracts Views on Vision4Press platform.
Data correspond to usage on the plateform after 2015. The current usage metrics is available 48-96 hours after online publication and is updated daily on week days.
Initial download of the metrics may take a while.