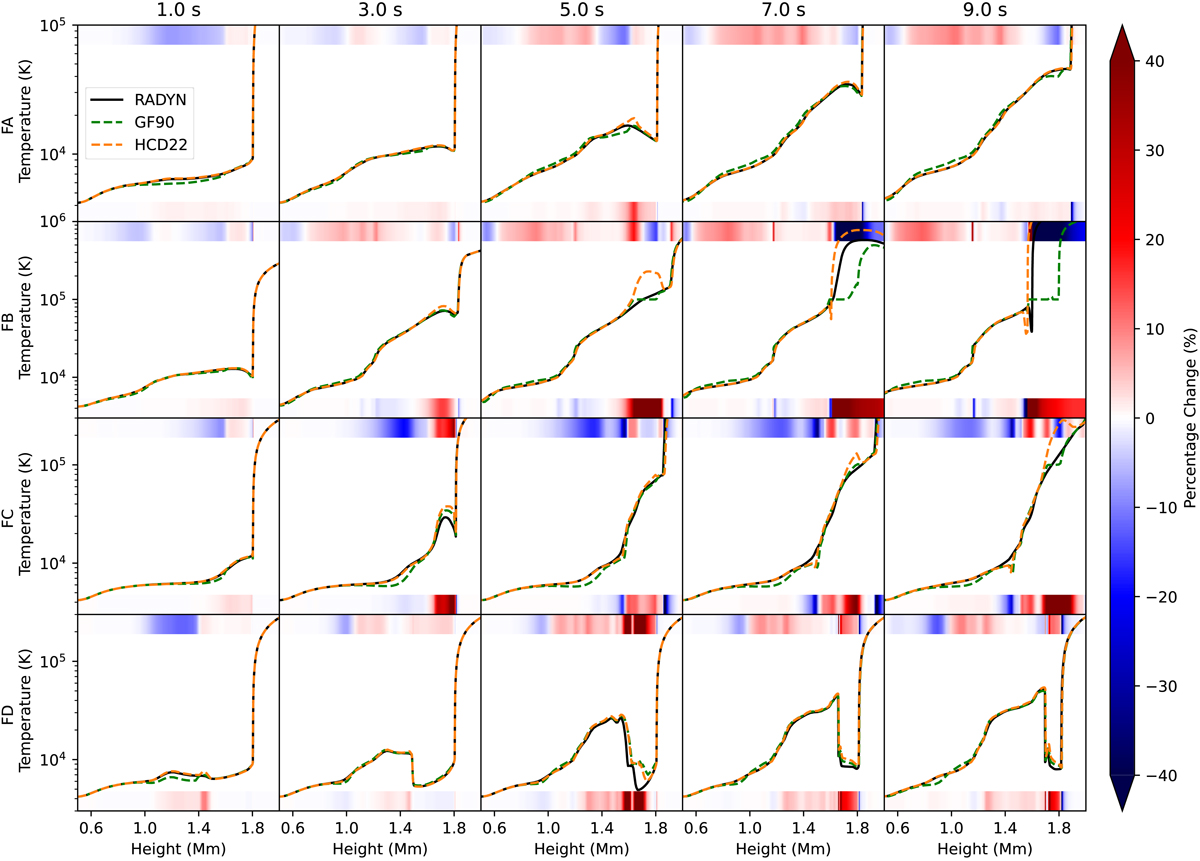
Fig. 1.
Download original image
Comparison of the evolution of the atmospheric structure. The top row shows the atmospheric temperature calculated with the detailed treatment of the radiative processes by RADYN (black solid lines), as well as that calculated using the recipe of GF90 (dashed green lines) and HCD22 (dashed orange lines) for Case FA. The following three rows are the same as the top row, but for Cases FB, FC, and FD, respectively. The temperature deviation between the GF90 and RADYN results is also shown as a horizontal bar at the top of each panel, and that between the HCD22 and RADYN results is shown at the bottom of each panel, in a color scale.
Current usage metrics show cumulative count of Article Views (full-text article views including HTML views, PDF and ePub downloads, according to the available data) and Abstracts Views on Vision4Press platform.
Data correspond to usage on the plateform after 2015. The current usage metrics is available 48-96 hours after online publication and is updated daily on week days.
Initial download of the metrics may take a while.