Fig. 4.
Download original image
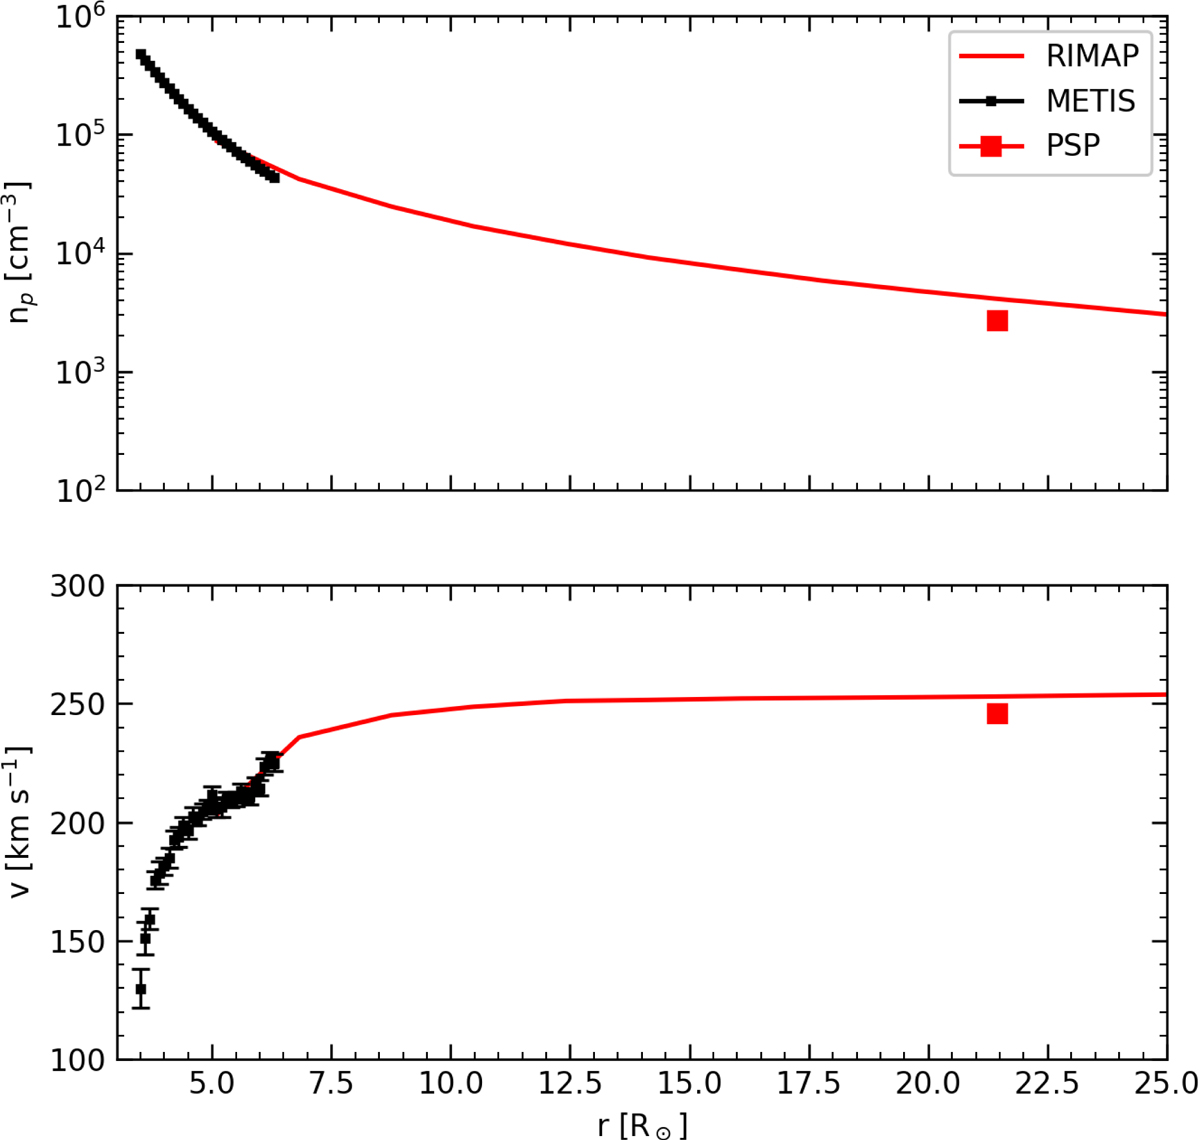
Comparison between observed (squares) and RIMAP-modelled (red line) proton number density (top panel) and outflow velocity (bottom panel) along the same streamline, from 3 to 25 R⊙. Black and red squares refer to Metis and PSP estimates, respectively.
Current usage metrics show cumulative count of Article Views (full-text article views including HTML views, PDF and ePub downloads, according to the available data) and Abstracts Views on Vision4Press platform.
Data correspond to usage on the plateform after 2015. The current usage metrics is available 48-96 hours after online publication and is updated daily on week days.
Initial download of the metrics may take a while.