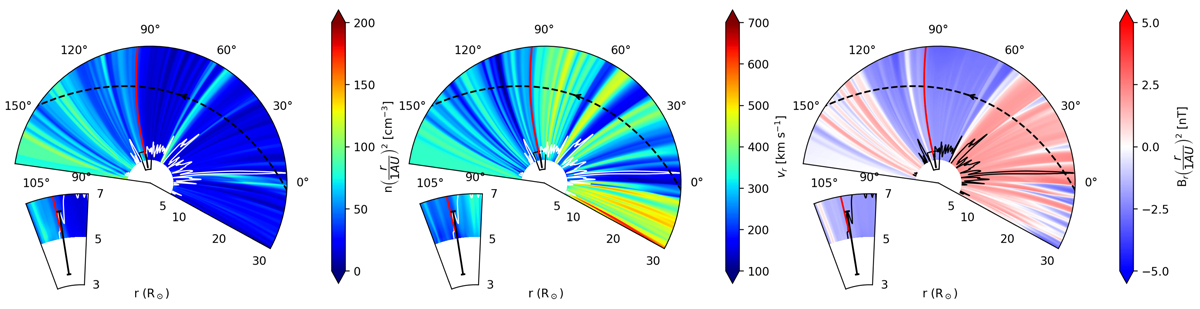
Fig. 2.
Download original image
Equatorial maps of plasma density, radial speed and magnetic field as simulated by RIMAP, starting from the PSP data collected from January 15 to 21, 2021. The dashed black line is the PSP trajectory (projected on the equatorial plane), and the black segment from 3.5 to 6.3 R⊙ is drawn at the Metis’ plane-of-the-sky latitude on January 17. The solid red line is the field line connecting PSP measurements and Metis observations. The white line (black in the third panel) represents the Alfvén point for each streamline.
Current usage metrics show cumulative count of Article Views (full-text article views including HTML views, PDF and ePub downloads, according to the available data) and Abstracts Views on Vision4Press platform.
Data correspond to usage on the plateform after 2015. The current usage metrics is available 48-96 hours after online publication and is updated daily on week days.
Initial download of the metrics may take a while.