Fig. 3.
Download original image
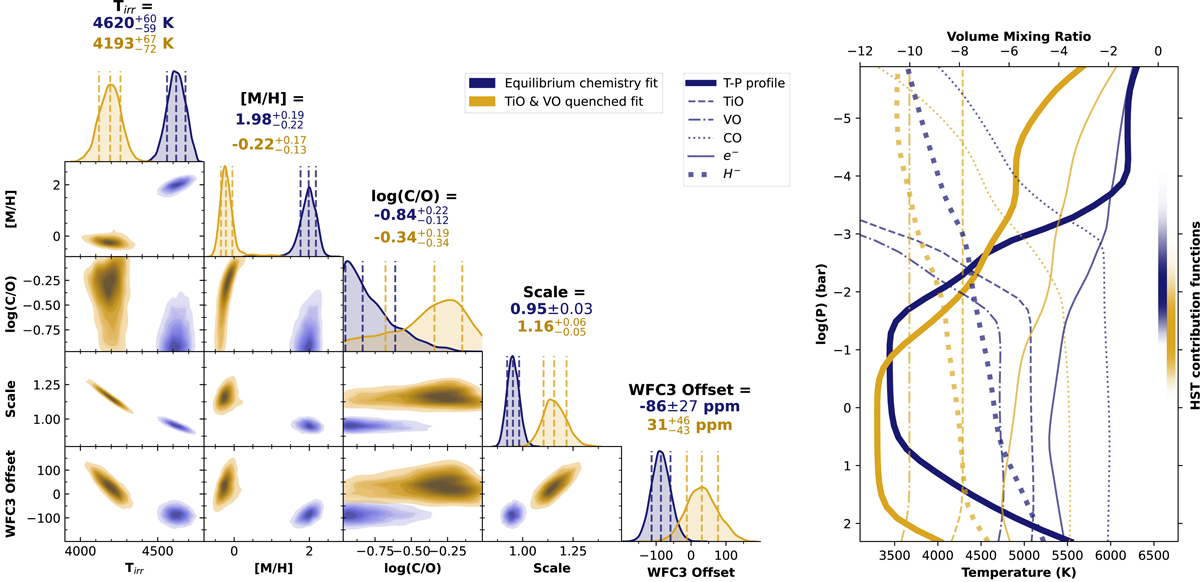
Results from the grid retrievals. Left: posterior distributions from the grid retrievals for the equilibrium chemistry model (dark blue) and the TiO–VO quenched model (yellow). Right: temperature–pressure profiles and the volume mixing ratios of a selection of the most important species for the equilibrium chemistry model and the TiO–VO quenched model. In the TiO–VO quenched model the TiO and VO VMRs are artificially enhanced to the maximum value of the atmospheric layers below, which is at 20 bar. Also plotted are the HST contribution functions. Spitzer probes the same pressure regions as HST.
Current usage metrics show cumulative count of Article Views (full-text article views including HTML views, PDF and ePub downloads, according to the available data) and Abstracts Views on Vision4Press platform.
Data correspond to usage on the plateform after 2015. The current usage metrics is available 48-96 hours after online publication and is updated daily on week days.
Initial download of the metrics may take a while.