Fig. 2.
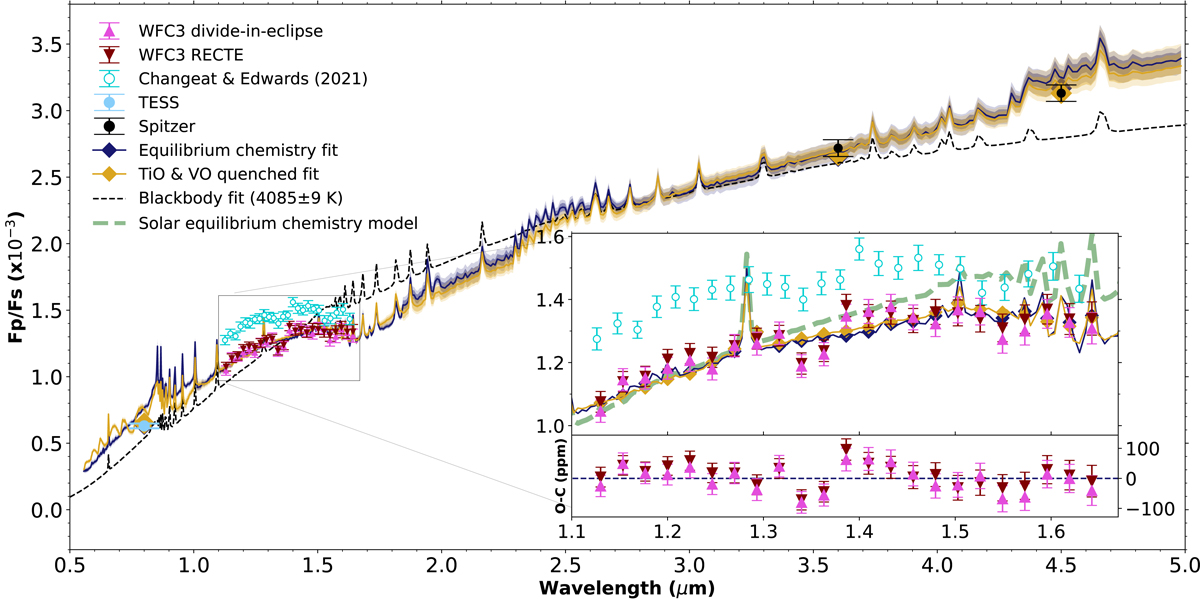
Download original image
Dayside eclipse spectrum from this work (red–pink), Changeat & Edwards (2021) (turquoise) and previous TESS/Spitzer observations (light blue–black) compared to the best-fit model spectra for equilibrium chemistry (dark blue), TiO and VO quenched chemistry (yellow), and a blackbody (dashed black). The shaded regions denote 1σ and 2σ model intervals. Spikes in the blackbody spectrum are stellar absorption lines. The inclusion of stellar pulsations causes an offset between the Changeat & Edwards (2021) data and our spectrum. In the inset we zoom in on the WFC3 spectrum and show the residuals of the data with respect to the equilibrium chemistry fit. The dashed green line shows a solar equilibrium chemistry model. This green model already deviates from the blackbody model redward of 1.4 μm due to H− opacities. The KELT-9b H− turnover is even larger than for this solar model.
Current usage metrics show cumulative count of Article Views (full-text article views including HTML views, PDF and ePub downloads, according to the available data) and Abstracts Views on Vision4Press platform.
Data correspond to usage on the plateform after 2015. The current usage metrics is available 48-96 hours after online publication and is updated daily on week days.
Initial download of the metrics may take a while.