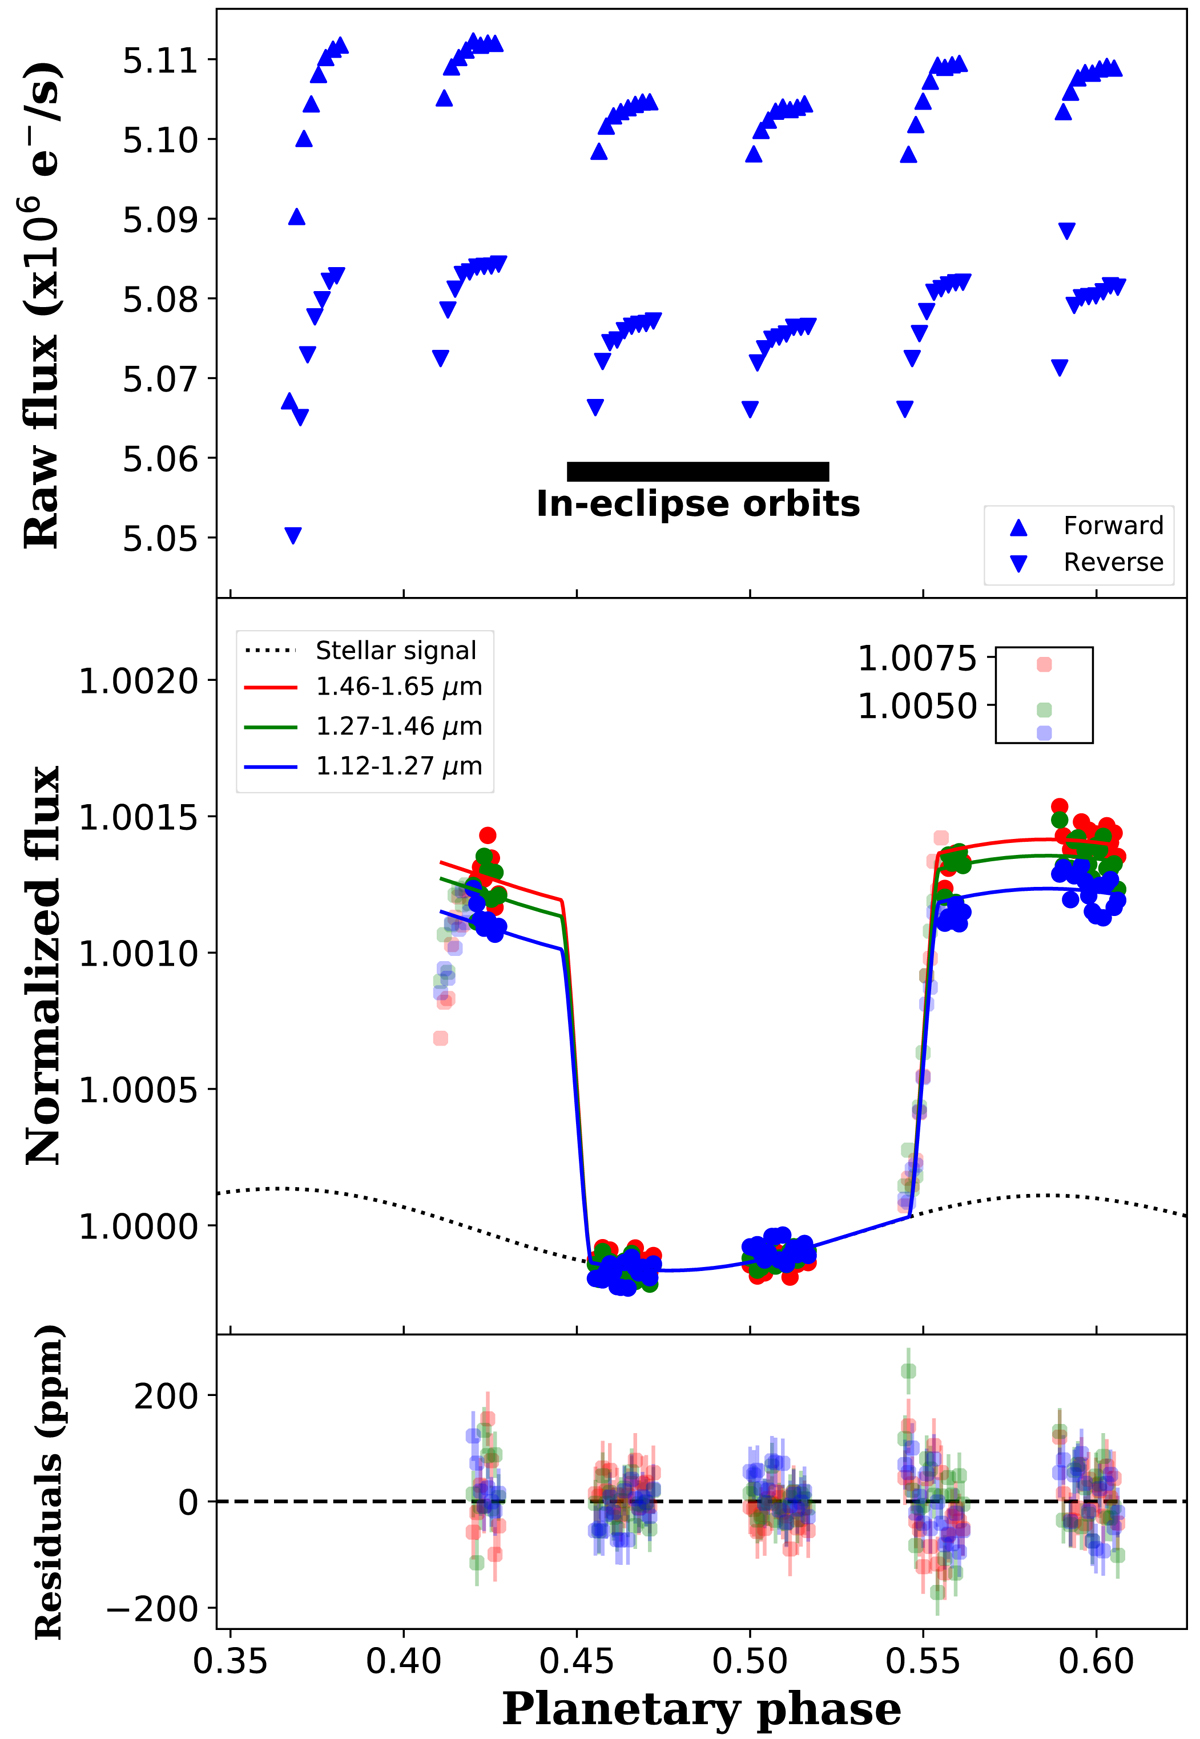
Fig. 1.
Download original image
Eclipse light curve of KELT-9b. Upper: raw light curve of HST/WFC3 for wavelengths of 1.12 − 1.27 μm for forward and reverse scanned data. We divide each orbit by the average of the two in-eclipse orbits. The result of this divide-in-eclipse method is shown in the middle panel in blue. Middle: eclipse light curve of HST/WFC3 split into three wavelength bins. The solid lines are best fits; the dotted line shows the stellar signal including pulsations, ellipsoidal variations, and Doppler boosting. The first orbit was discarded entirely. The inset shows the exposure affected by a satellite crossing. In our fits the grayed-out points in the first orbit, the points in egress, and the satellite crossing were excluded. Lower: residuals from the fit in the middle panel. The divide-in-eclipse method induces larger residuals outside eclipse, although a deviation from our model is still visible in egress. The RECTE equivalent of the lower two panels is shown in Appendix A.
Current usage metrics show cumulative count of Article Views (full-text article views including HTML views, PDF and ePub downloads, according to the available data) and Abstracts Views on Vision4Press platform.
Data correspond to usage on the plateform after 2015. The current usage metrics is available 48-96 hours after online publication and is updated daily on week days.
Initial download of the metrics may take a while.