Fig. 7.
Download original image
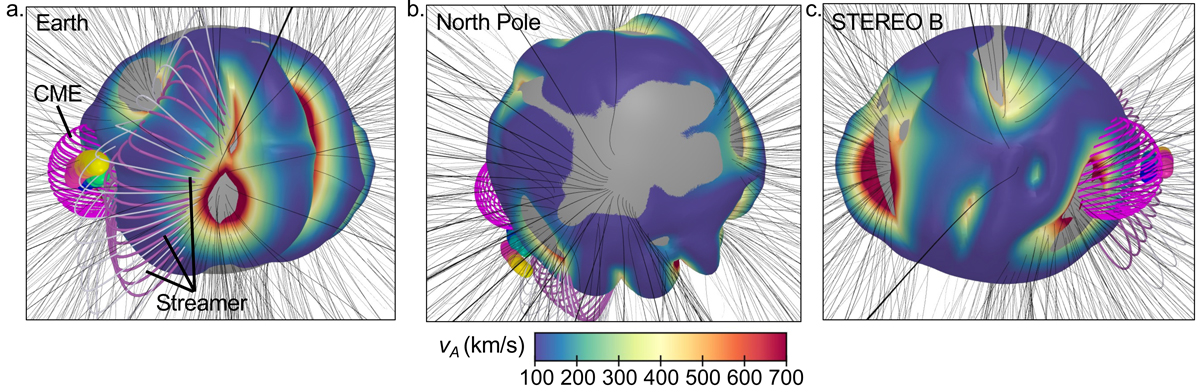
Modelling of the solar corona during the eruption and herringbone emission. Results of the MAST model showing the 173 MHz harmonic plasma level height, the Alfvén speed (vA) at that height, and coronal magnetic field lines from three perspectives: Earth (a), solar North Pole (b), and STEREO B (c). The colour bar at the bottom of the figure represents the scale of the Alfvén speed values. Also included in these images are the CME bubble consisting of a magenta wire mesh and the herringbone sources at 173 and 228 MHz using the same colouring as in Fig. 6. The herringbone sources are roughly located outside the CME and on the side of the closed magnetic field lines that represent a coronal streamer (d).
Current usage metrics show cumulative count of Article Views (full-text article views including HTML views, PDF and ePub downloads, according to the available data) and Abstracts Views on Vision4Press platform.
Data correspond to usage on the plateform after 2015. The current usage metrics is available 48-96 hours after online publication and is updated daily on week days.
Initial download of the metrics may take a while.