Fig. 2.
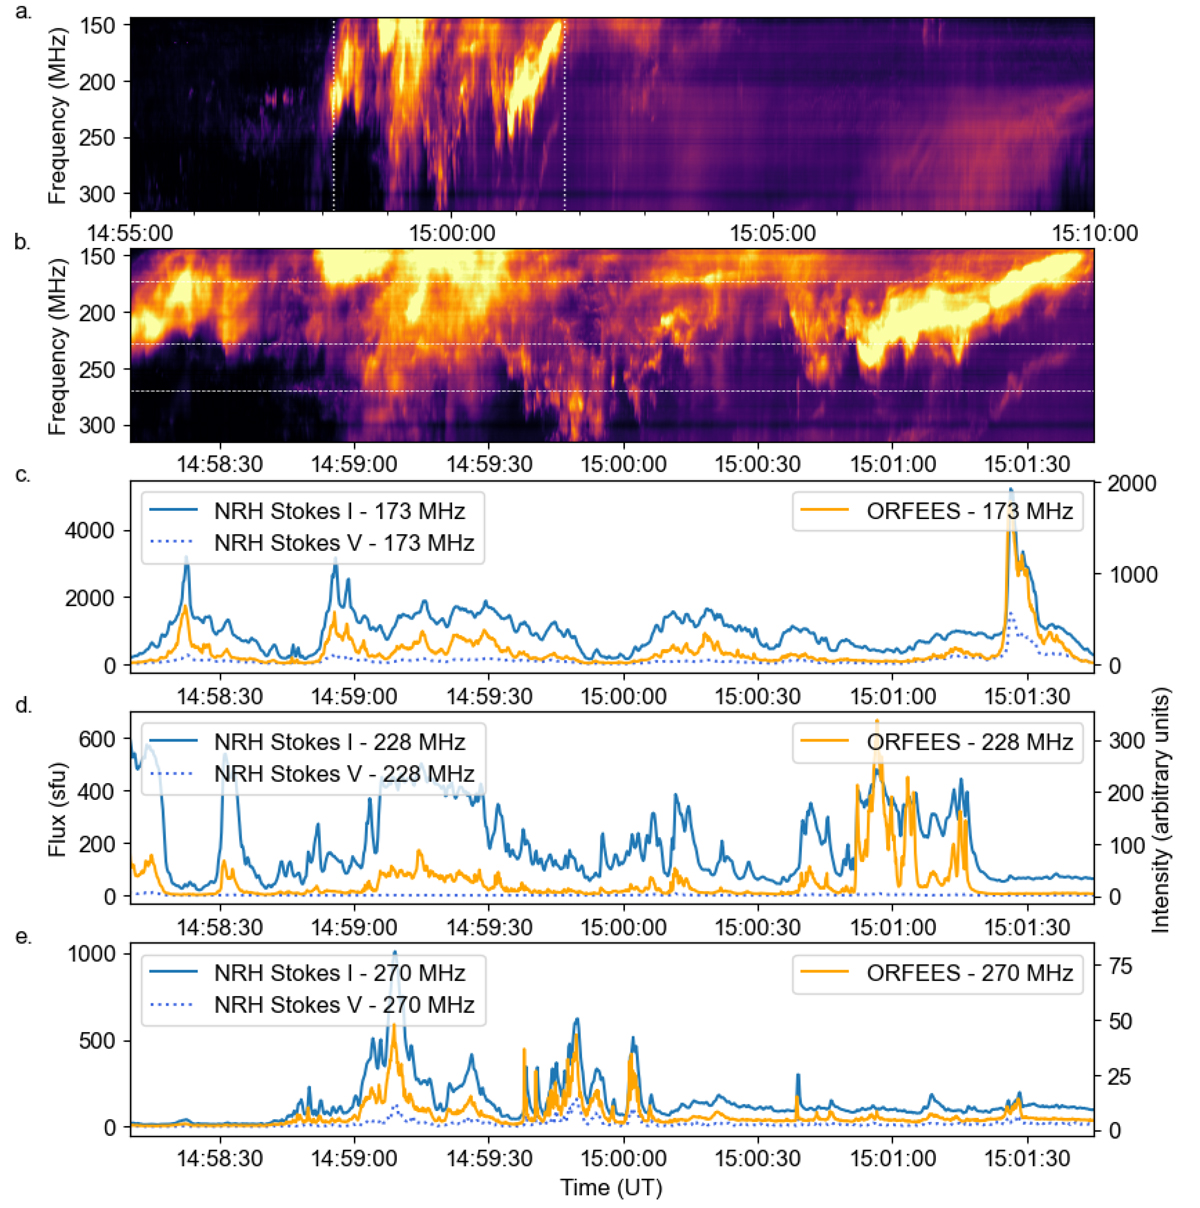
Download original image
Herringbone dynamic spectrum and their fluxes obtained from NRH images. (a) ORFEES dynamic spectrum during the herringbone event. (b) Zoom-in of the top panel focussing on groups of herringbones. The last three panels show the flux of the herringbone sources together with the relative intensity extracted from the ORFEES dynamic spectrum at three frequencies: 173 (c), 228 (d), and 270 MHz (e). These plots show that the radio sources imaged by the NRH are indeed the herringbone bursts seen in the ORFEES dynamic spectrum.
Current usage metrics show cumulative count of Article Views (full-text article views including HTML views, PDF and ePub downloads, according to the available data) and Abstracts Views on Vision4Press platform.
Data correspond to usage on the plateform after 2015. The current usage metrics is available 48-96 hours after online publication and is updated daily on week days.
Initial download of the metrics may take a while.