Fig. 5.
Download original image
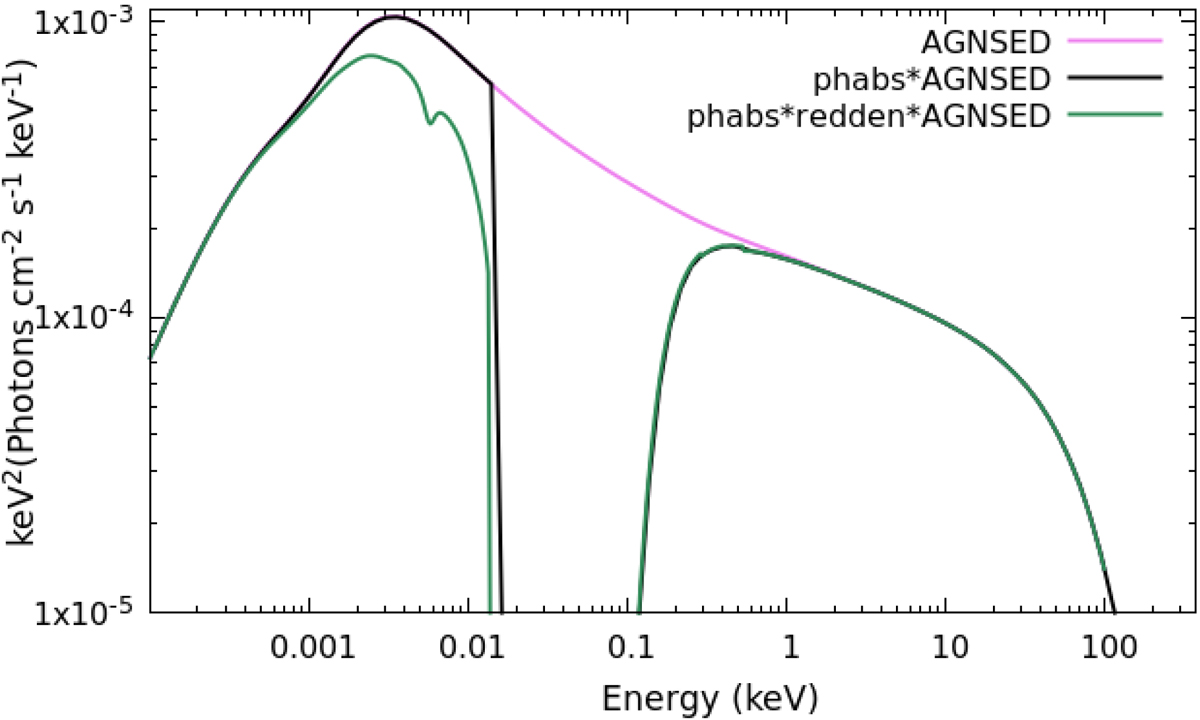
Energy flux EFE of the model components plotted individually in order to illustrate their importance in comparison with the Gaussian functions. The pure AGNSED component is plotted by the pink line, the influence of Galactic absorption is shown by the black line, and the influence of reddening by the green line. All models are plotted based on the parameters taken from Table 2.
Current usage metrics show cumulative count of Article Views (full-text article views including HTML views, PDF and ePub downloads, according to the available data) and Abstracts Views on Vision4Press platform.
Data correspond to usage on the plateform after 2015. The current usage metrics is available 48-96 hours after online publication and is updated daily on week days.
Initial download of the metrics may take a while.