Fig. 9
Download original image
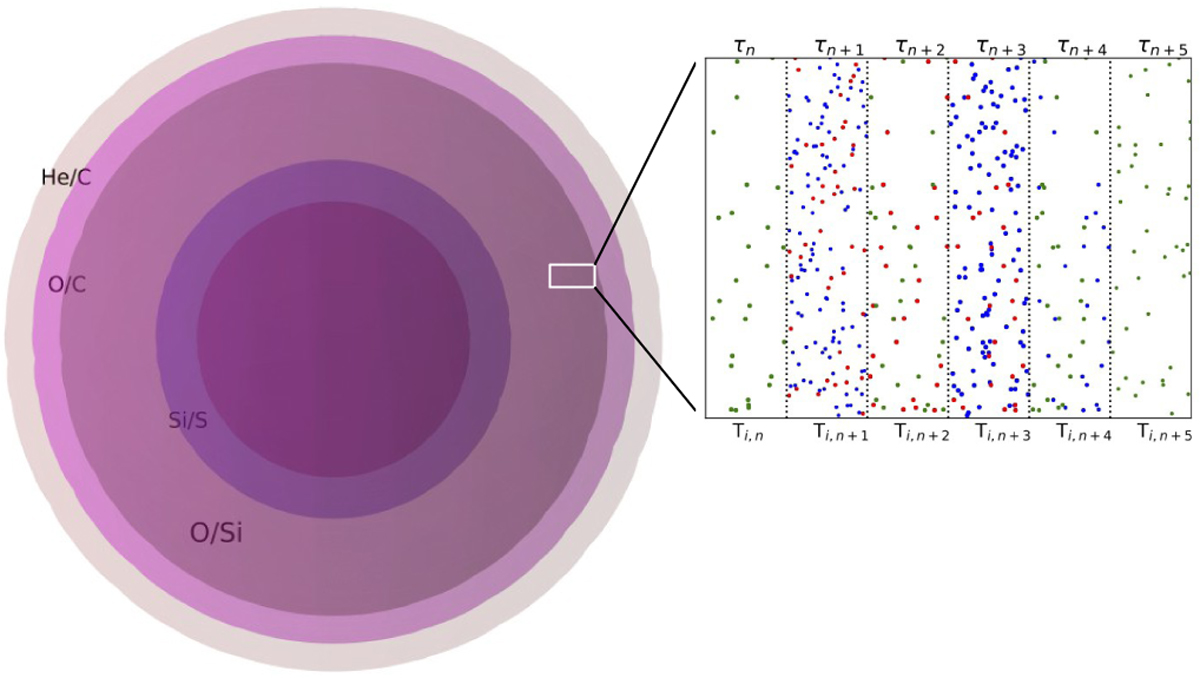
Schematics of the geometry is shown, where the ejecta is characterized by different zones according to the abundances of elements, while each zone is stratified into several layers, defined by unique gas densities in the clumps, as well as unique dust and gas temperatures. As a result, the efficiency of dust production varies widely among the layers, and so do the opacities. The zoomed-in view of the small random rectangular cross-section of the gas indicates the unique dust densities, dust temperatures, and opacities in its different layers (despite being entirely in the O core).
Current usage metrics show cumulative count of Article Views (full-text article views including HTML views, PDF and ePub downloads, according to the available data) and Abstracts Views on Vision4Press platform.
Data correspond to usage on the plateform after 2015. The current usage metrics is available 48-96 hours after online publication and is updated daily on week days.
Initial download of the metrics may take a while.