Fig. 5
Download original image
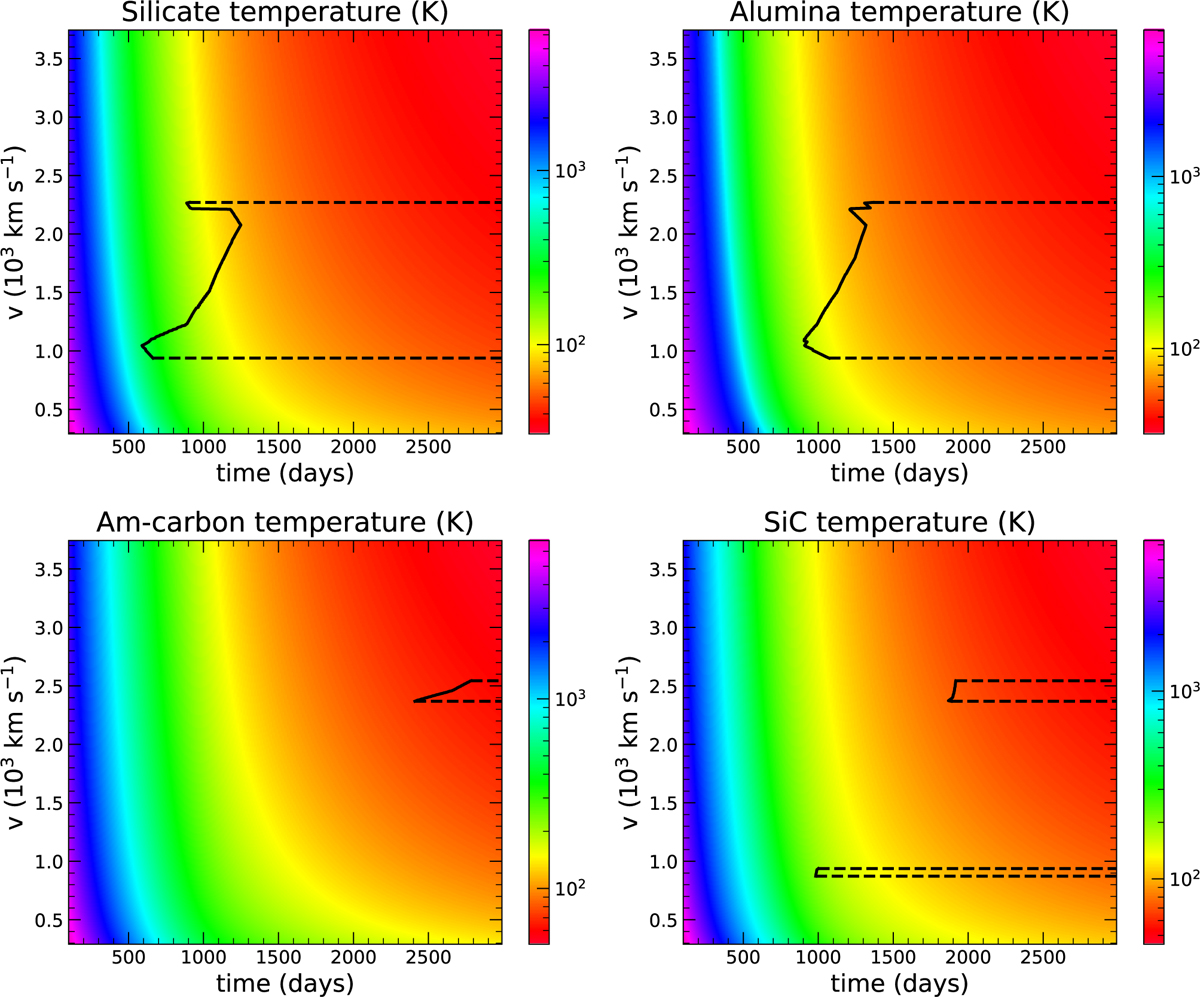
Resulting dust temperatures for silicates (top left), alumina (top right), carbon (bottom left), and silicon carbide (bottom right) are shown for different days and different velocity bins. The solid black lines refer to loci in terms of time and velocity, when the dust formation starts in a particular bin. The enclosed area inside the contours (dashed black lines) represents the space where that dust species is present (see Sect. 3 for details).
Current usage metrics show cumulative count of Article Views (full-text article views including HTML views, PDF and ePub downloads, according to the available data) and Abstracts Views on Vision4Press platform.
Data correspond to usage on the plateform after 2015. The current usage metrics is available 48-96 hours after online publication and is updated daily on week days.
Initial download of the metrics may take a while.