Open Access
Fig. 2
Download original image
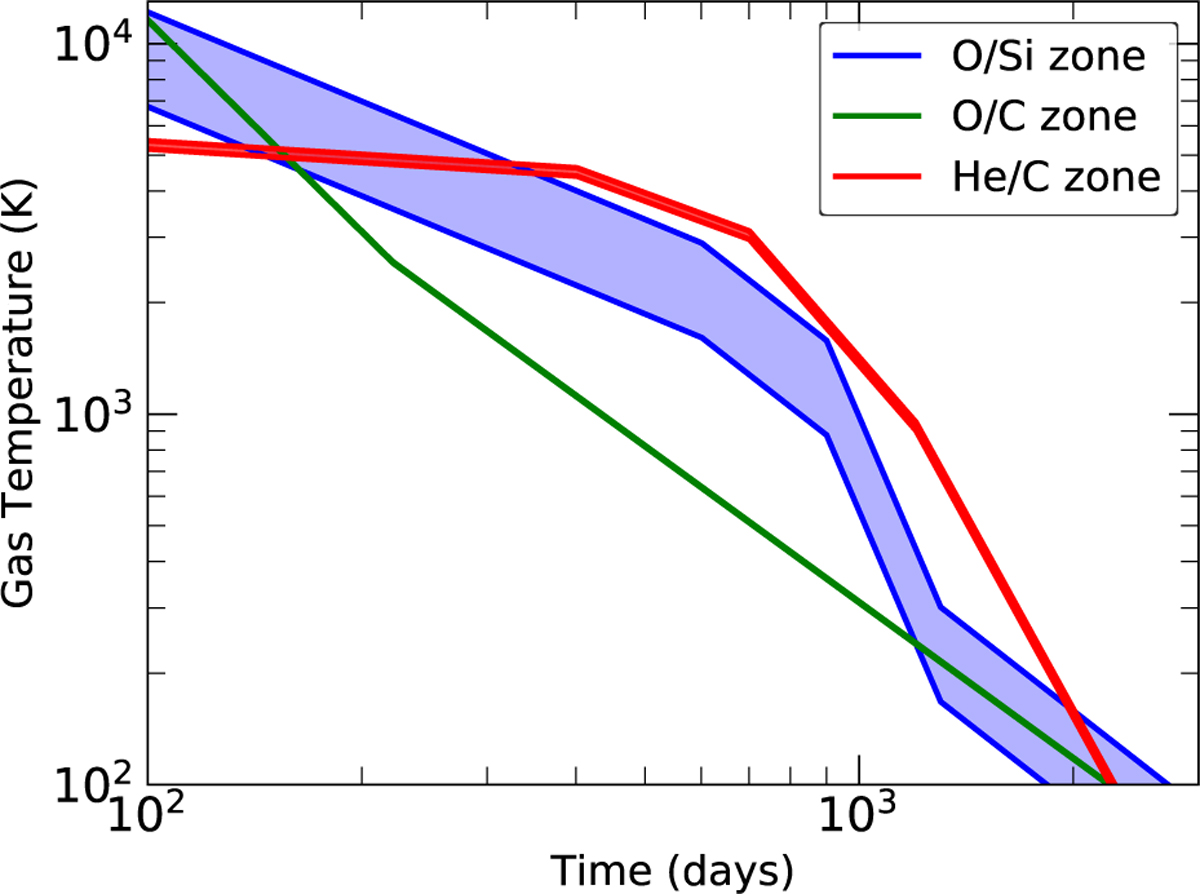
Range of gas temperatures in different zones and their variation with post-explosion time is shown (see Sect. 2.2 for details). Even though our model does not depend on these coarse zone divisions of the ejecta, this is particularly helpful to understand how the gas temperatures evolve.
Current usage metrics show cumulative count of Article Views (full-text article views including HTML views, PDF and ePub downloads, according to the available data) and Abstracts Views on Vision4Press platform.
Data correspond to usage on the plateform after 2015. The current usage metrics is available 48-96 hours after online publication and is updated daily on week days.
Initial download of the metrics may take a while.