Fig. 18
Download original image
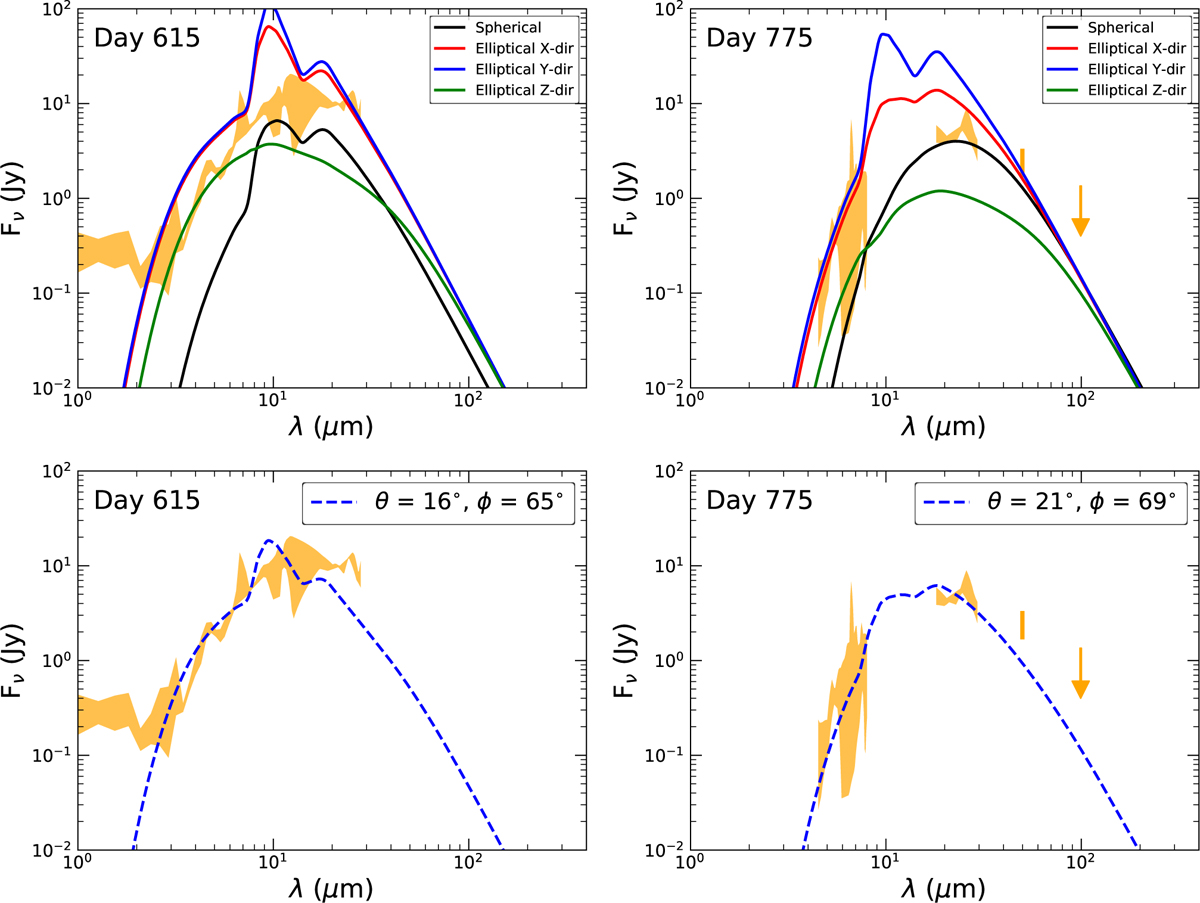
Fluxes obtained from our calculations (assuming the SN to be at the distance of SN 1987A) for days 615 and 775, are co-plotted with the near- and mid-IR data of SN 1987A (shaded region in yellow) from Wesson et al. (2015). In the top panel, the fluxes for the isotropic model, as well as the three axial directions of the anisotropic model, are shown for the two epochs. In the bottom panel, we show the viewing angle with respect to the coordinates shown in Fig. 15, where we find the fluxes emerging from the anisotropic ejecta match well with the observations. For the details, see Sect. 5.3.
Current usage metrics show cumulative count of Article Views (full-text article views including HTML views, PDF and ePub downloads, according to the available data) and Abstracts Views on Vision4Press platform.
Data correspond to usage on the plateform after 2015. The current usage metrics is available 48-96 hours after online publication and is updated daily on week days.
Initial download of the metrics may take a while.