Fig. 15
Download original image
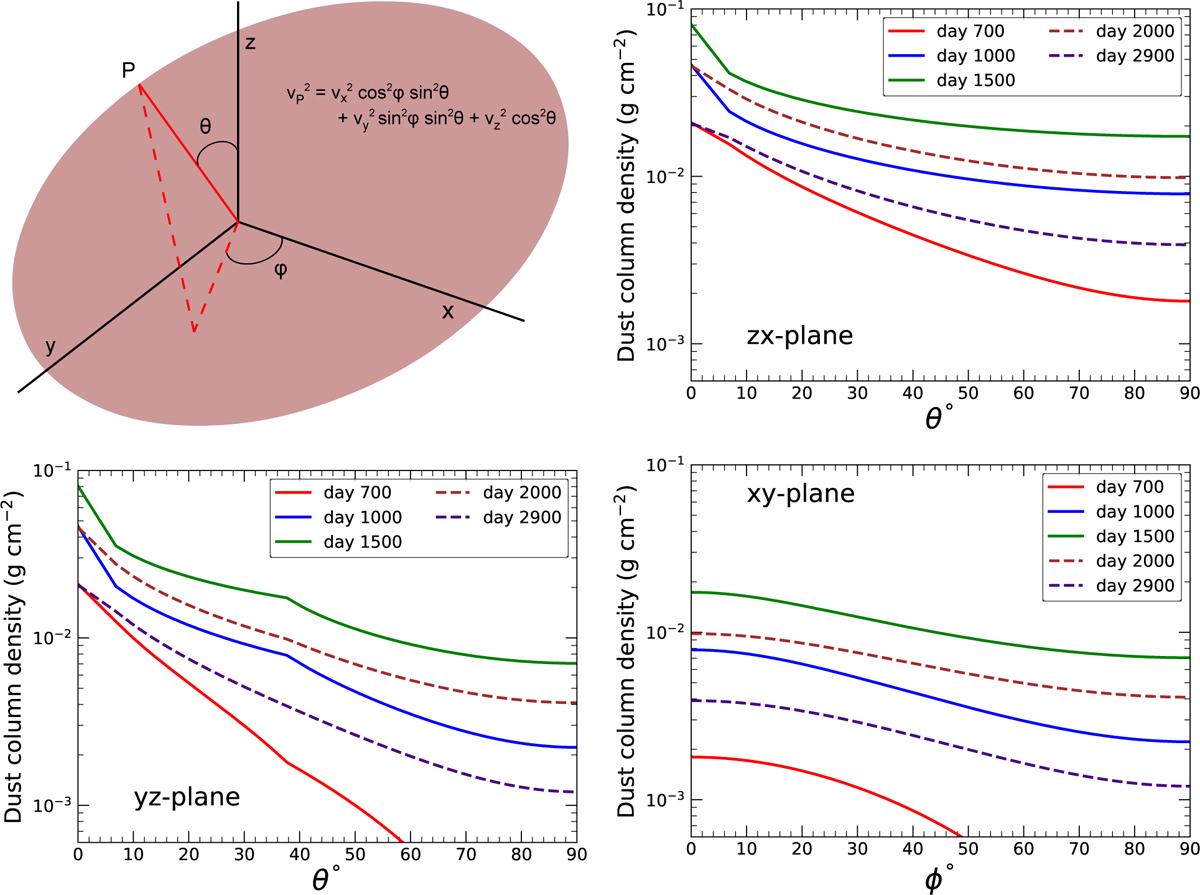
Dust column densities are shown for the ellipsoidal model for five different epochs. In the top left panel, the chosen polar coordinates are shown in terms of θ and φ for an ellipsoidal shell. The velocity of any clump at point P inside the shell is calculated. In the top right panel and the bottom panel, we show the evolution of dust column densities (from the center to the outer edge of the ejecta) along various directions as a function of the viewing angle, in the three axial planes. See Sect. 5.1 for details.
Current usage metrics show cumulative count of Article Views (full-text article views including HTML views, PDF and ePub downloads, according to the available data) and Abstracts Views on Vision4Press platform.
Data correspond to usage on the plateform after 2015. The current usage metrics is available 48-96 hours after online publication and is updated daily on week days.
Initial download of the metrics may take a while.