Fig. 1
Download original image
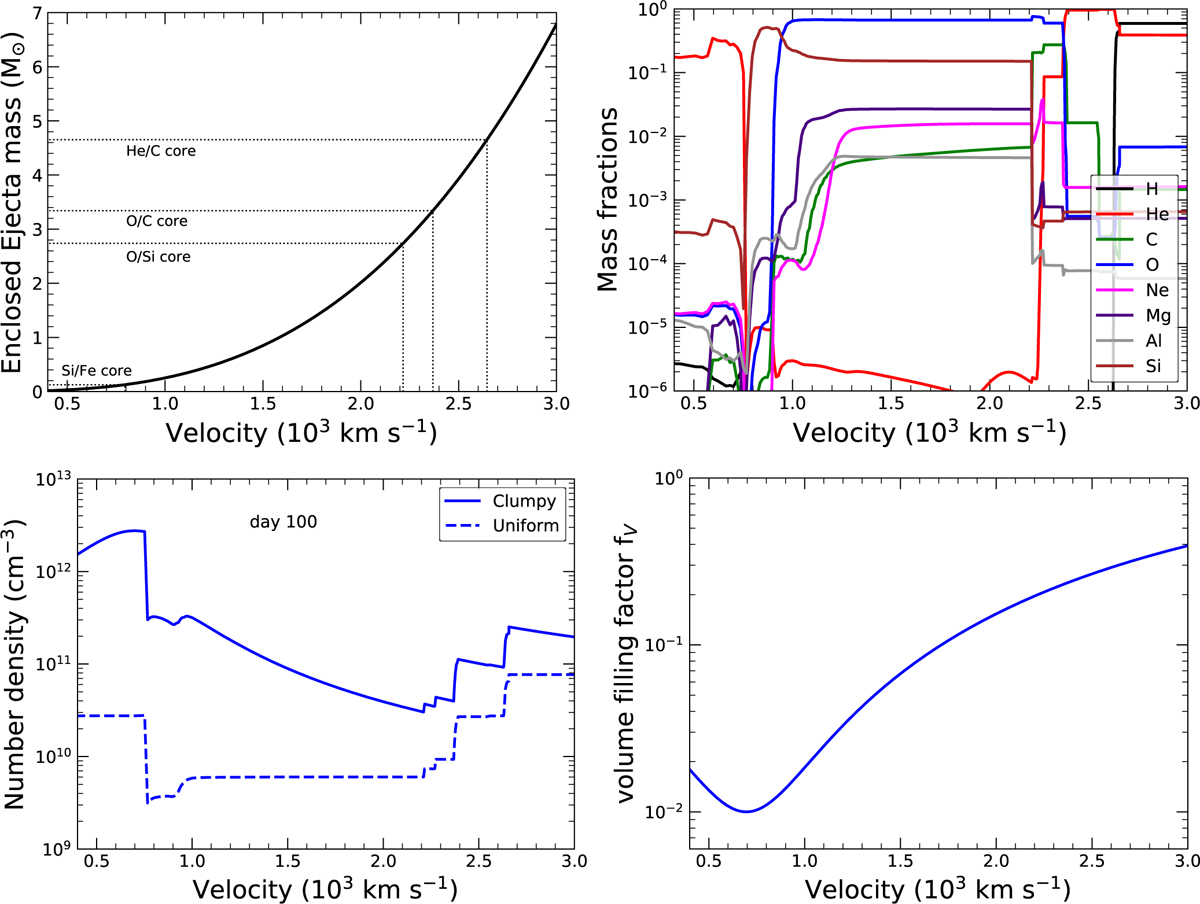
Mass and density distribution of SN ejecta are presented in the velocity space. Top left: enclosed mass of the ejecta as a function of the ejecta velocity is shown. The He, O, and Si-cores are marked on the figures, with the respective mass-velocity boundaries (see Sect. 2). Top right: fractional abundances of the elements (H, He, C, O, Ne, Mg, and Si), taken from Rauscher et al. (2002), are shown as a function of ejecta velocity, where the mass-velocity relation can be derived from the figure on the left, as shown in Sect. 2. Bottom left: distribution of gas (number) densities in the ejecta, as the function of velocity at 100 days post-explosion (see Sect. 2.1). The densities for uniform ejecta are shown for reference, but we only model the scenario of clumpy ejecta. Bottom right: volume filling factor for the clumps are shown with reference to Eq. (5).
Current usage metrics show cumulative count of Article Views (full-text article views including HTML views, PDF and ePub downloads, according to the available data) and Abstracts Views on Vision4Press platform.
Data correspond to usage on the plateform after 2015. The current usage metrics is available 48-96 hours after online publication and is updated daily on week days.
Initial download of the metrics may take a while.