Fig. 5.

Download original image
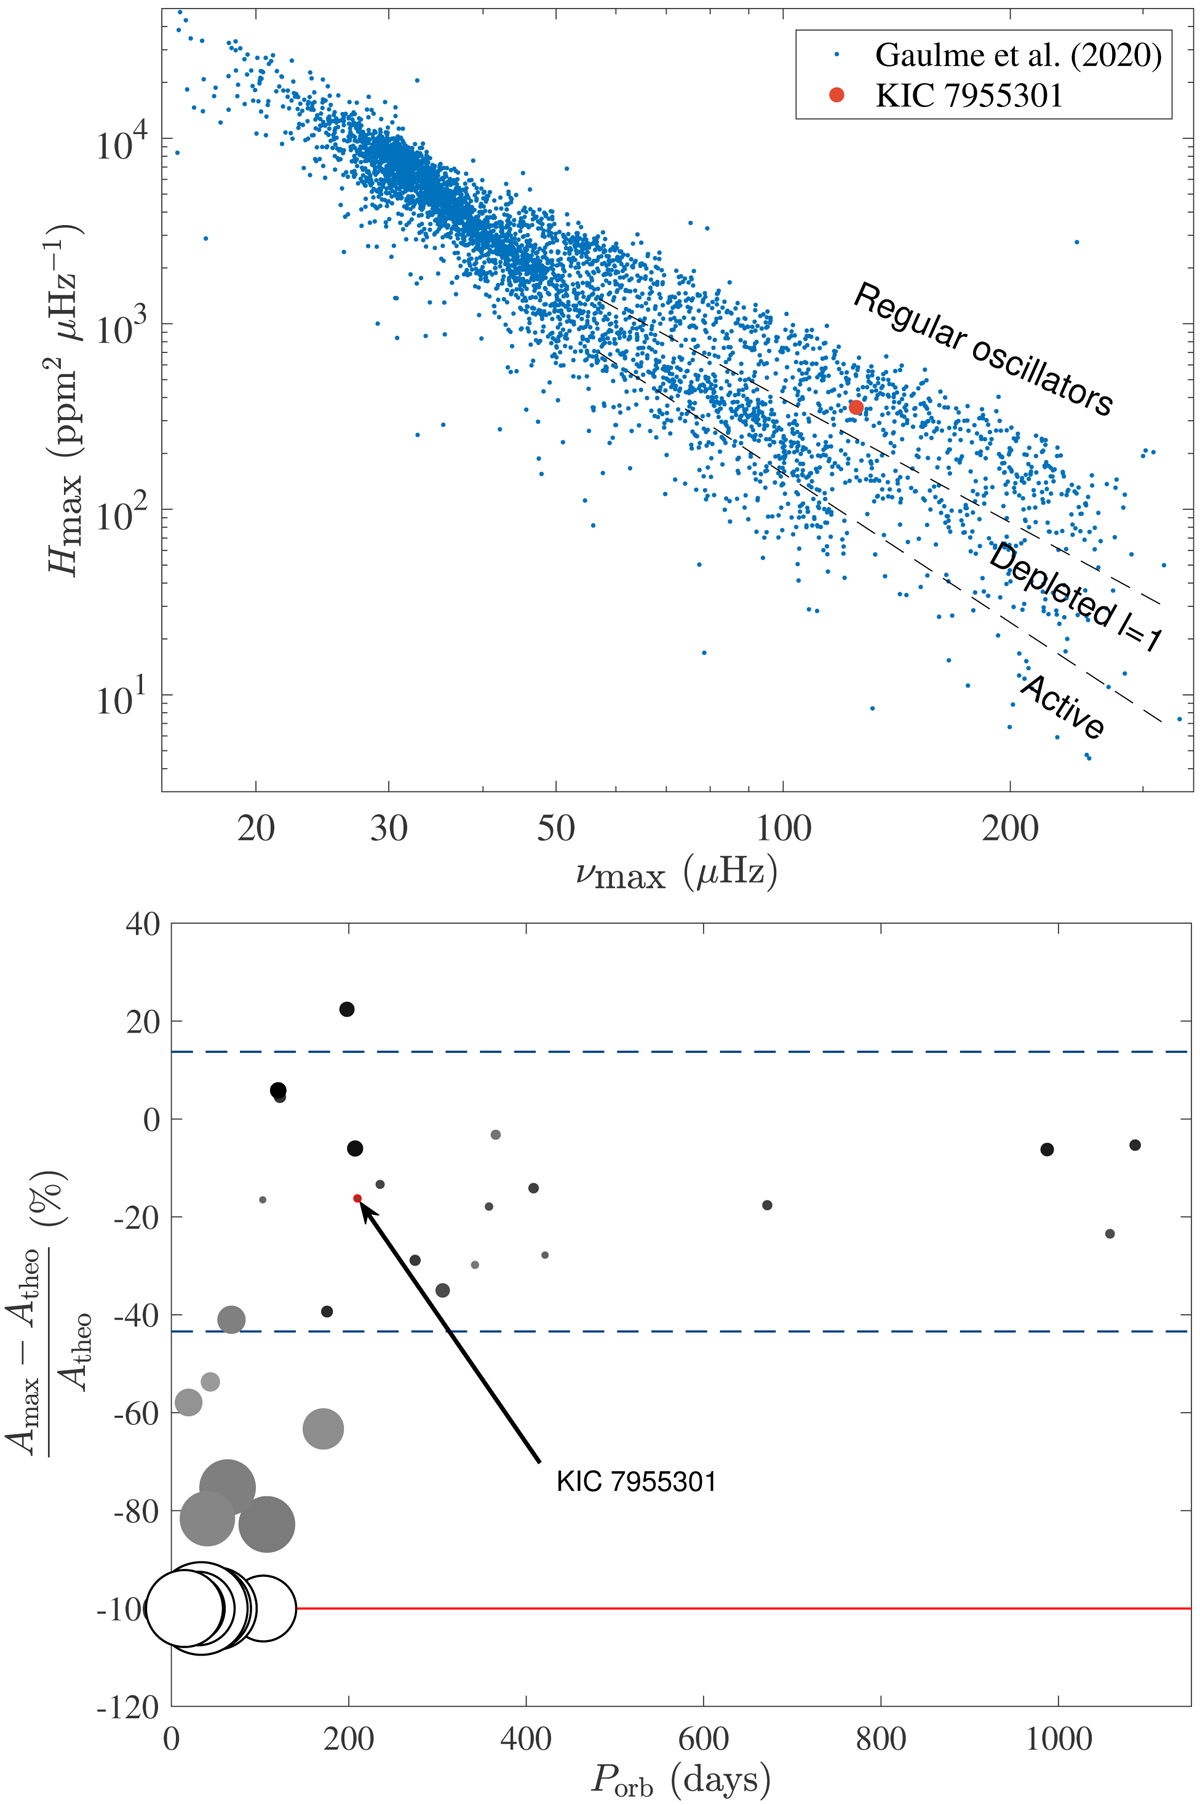
Oscillation amplitude. Top panel: height of the Gaussian envelope used to model the contribution of the oscillations to the stellar background. The red dot highlights the position of KIC 7955301 with respect to a sample of 4500 RGs analyzed by Gaulme et al. (2020) indicated in blue. The sample splits into three categories: the oscillators with regular amplitude, those with depleted l = 1 modes, and the active RGs that show a global mode suppression (l = 0, 1, 2, 3). KIC 7955301 falls in the regular oscillators. Bottom panel: Amplitude of the largest l = 0 mode of KIC 7955301 compared with those of the 35 RGs in EBs that were studied by Benbakoura et al. (2021). The panel displays the relative difference between expected and measured oscillation amplitudes (%) as a function of orbital period Porb (days). The red line indicates 0, i.e., stars whose oscillations are not detected. The two dashed blue lines represent the region in which relative mode amplitude lies for systems with orbital periods longer than 180 days within two sigma. The size of each symbol represents the amplitude of stellar variability (large means variable, small means not variable), and the gray scale indicates the pulsation mode amplitude (white means no modes; black means a large amplitude).
Current usage metrics show cumulative count of Article Views (full-text article views including HTML views, PDF and ePub downloads, according to the available data) and Abstracts Views on Vision4Press platform.
Data correspond to usage on the plateform after 2015. The current usage metrics is available 48-96 hours after online publication and is updated daily on week days.
Initial download of the metrics may take a while.


