Fig. 1.

Download original image
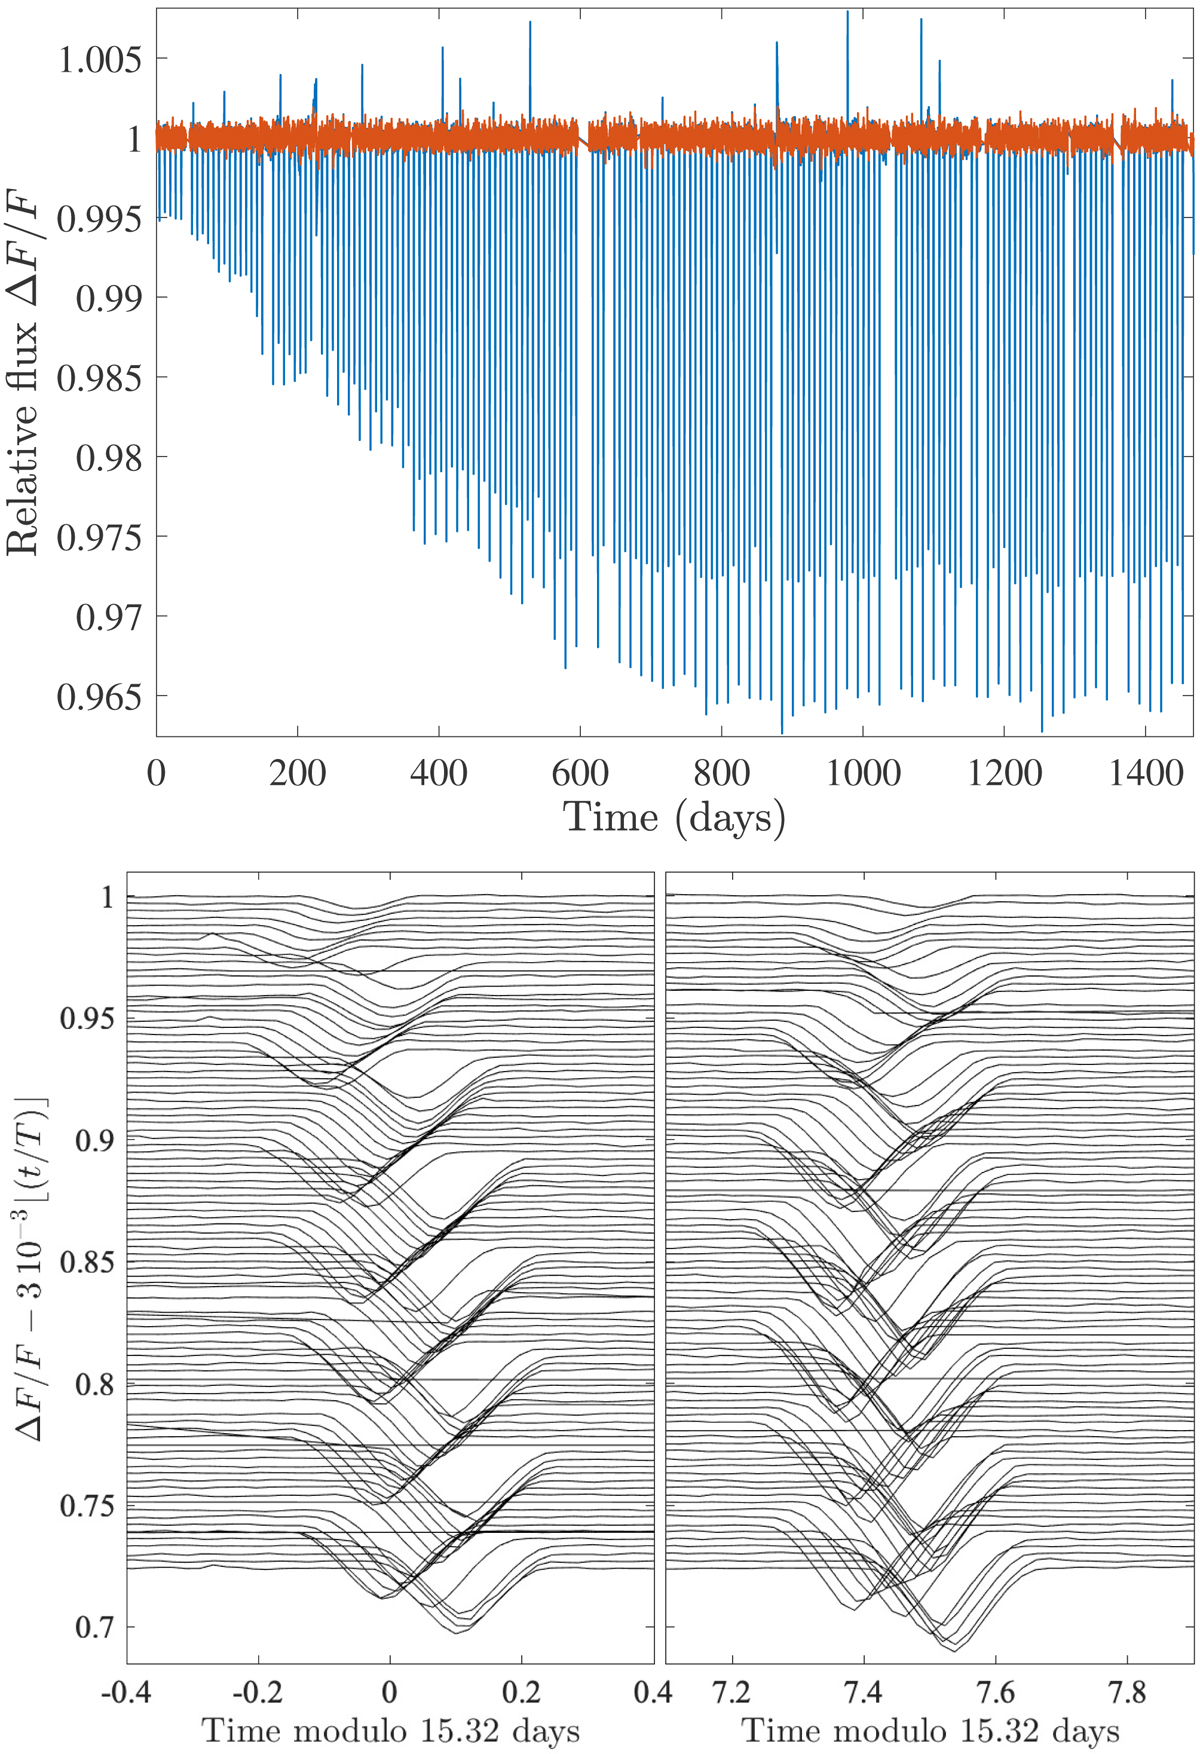
Kepler light curve of KIC 7955301. Top panel: relative flux as a function of time, where t = 0 is the first day of data. The blue curve is the stitched light curve, whereas the orange curve has the eclipses removed and is used for asteroseismic analysis. Bottom panel: stitched light curve folded over the inner binary orbital period (15.32 days), where consecutive eclipses are vertically offset by 0.003 to ease the visibility of the transit depth and timing variations.
Current usage metrics show cumulative count of Article Views (full-text article views including HTML views, PDF and ePub downloads, according to the available data) and Abstracts Views on Vision4Press platform.
Data correspond to usage on the plateform after 2015. The current usage metrics is available 48-96 hours after online publication and is updated daily on week days.
Initial download of the metrics may take a while.


