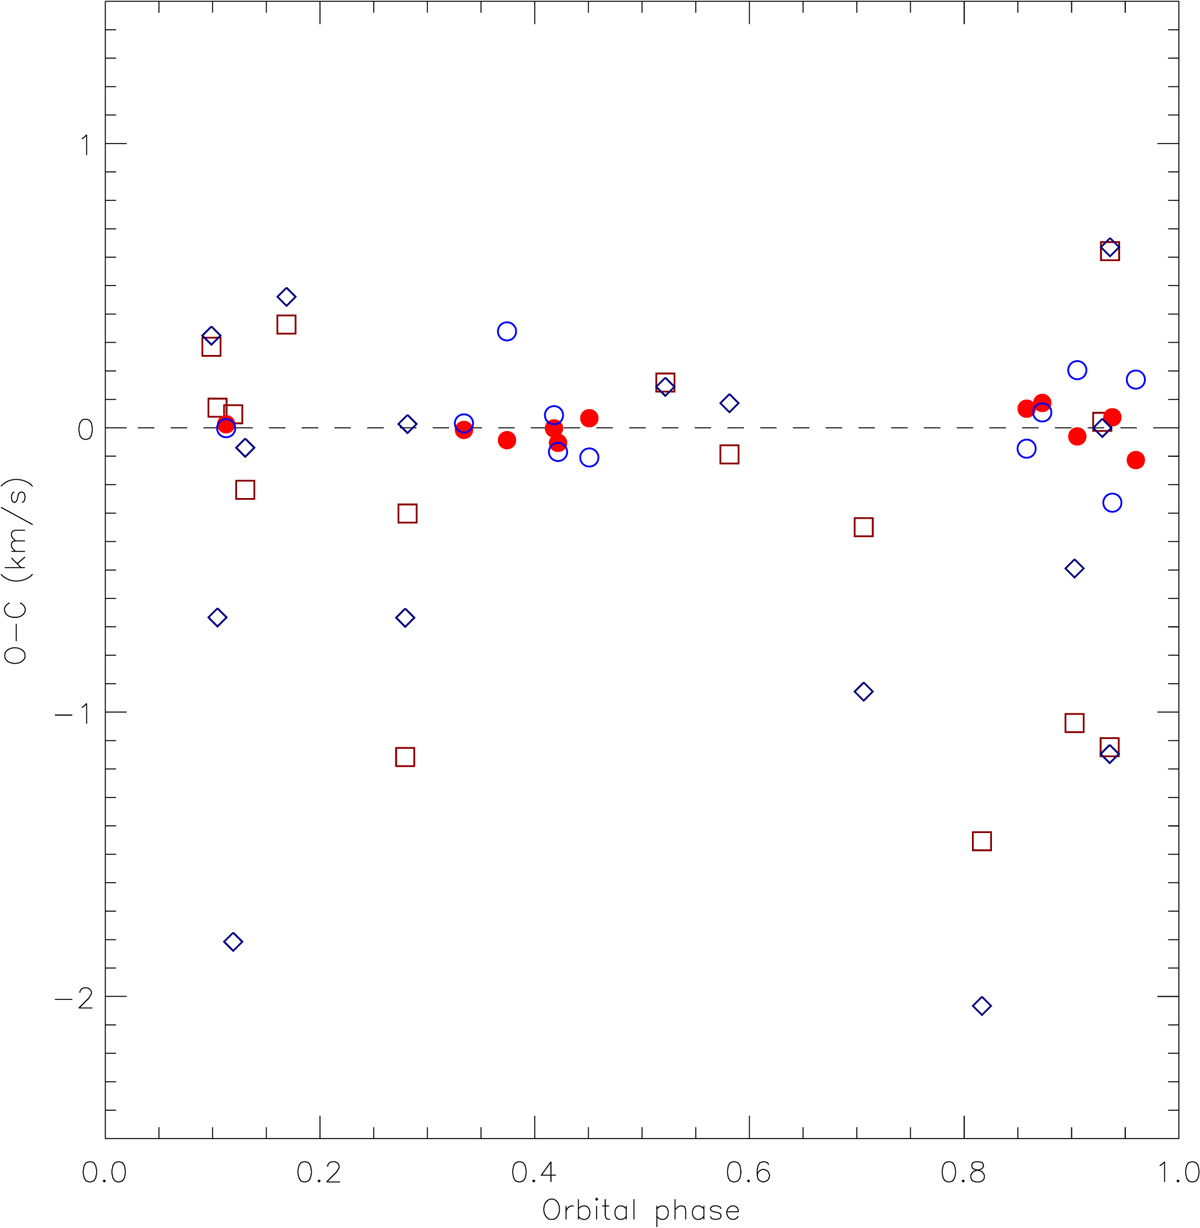
Fig. 2.
Download original image
O–C diagram from the binary model in Fig. 1. Red solid circles correspond to our measurements of the primary component, blue open circles are for the secondary component. Dark red squares and navy diamonds represent the measurements of Benbakoura et al. (2021) for the primary and secondary star, respectively, with phases and O–C calculated relative to our binary solution.
Current usage metrics show cumulative count of Article Views (full-text article views including HTML views, PDF and ePub downloads, according to the available data) and Abstracts Views on Vision4Press platform.
Data correspond to usage on the plateform after 2015. The current usage metrics is available 48-96 hours after online publication and is updated daily on week days.
Initial download of the metrics may take a while.