Fig. 6.
Download original image
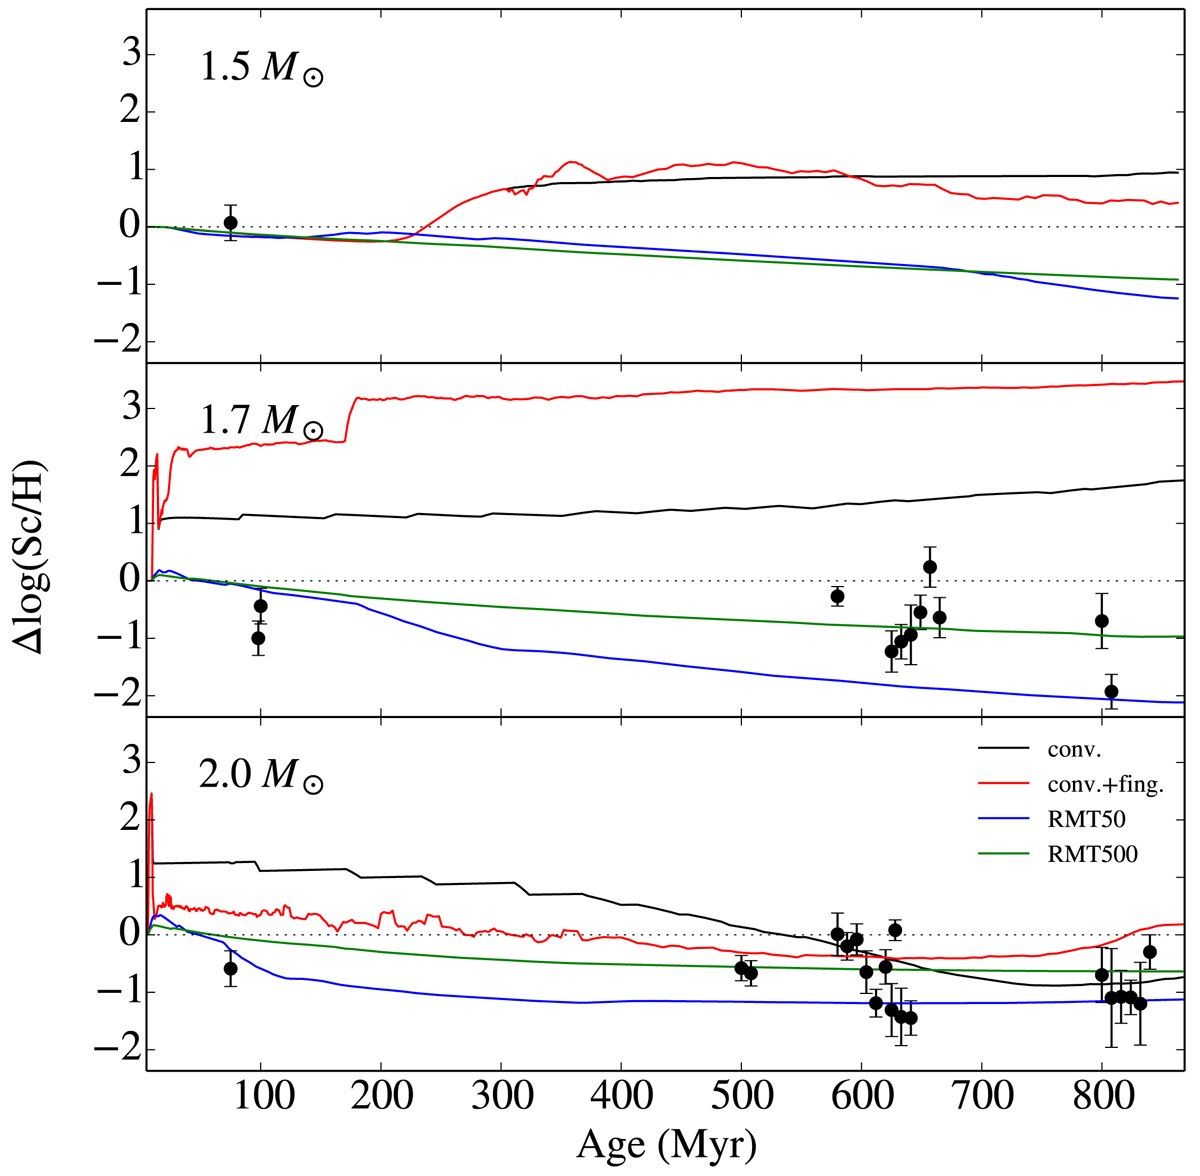
Comparison between the scandium surface abundance of our models without mass loss and the observed values of Table 1. The abundances are expressed as the difference between the logarithm of the actual value relative to H and the initial one. The colours of the tracks refer to the same transport process assumptions as in Fig. 4 and are recalled in the lower panel. For the sake of legibility, an offset has been added to the abscissa for stars of same age. The horizontal thin dotted line represents the initial abundance.
Current usage metrics show cumulative count of Article Views (full-text article views including HTML views, PDF and ePub downloads, according to the available data) and Abstracts Views on Vision4Press platform.
Data correspond to usage on the plateform after 2015. The current usage metrics is available 48-96 hours after online publication and is updated daily on week days.
Initial download of the metrics may take a while.