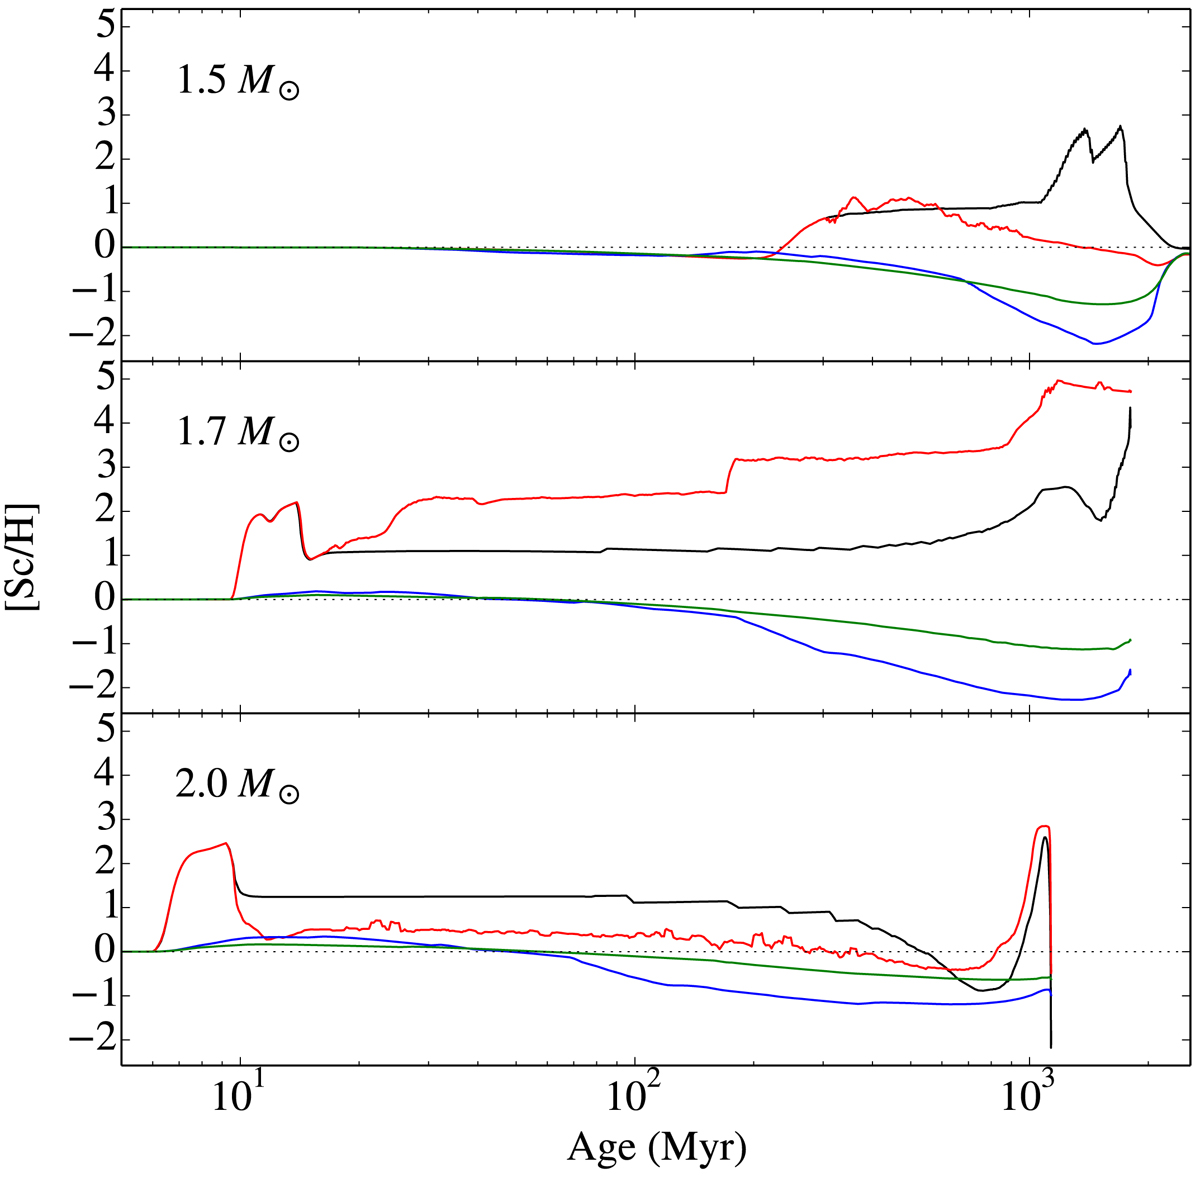
Fig. 4.
Download original image
Evolution with time of the superficial abundance of Sc for models with convection only (black curves), with convection and fingering mixing (red curves), and with full mixing down to the Z-bump with ω = 50 (blue curves) and 500 (green curves). The stellar mass is shown in each panel. The thin dotted line represents the initial abundance. The vertical axis has the same range in all the panels. The thin dotted curve represents the initial abundance.
Current usage metrics show cumulative count of Article Views (full-text article views including HTML views, PDF and ePub downloads, according to the available data) and Abstracts Views on Vision4Press platform.
Data correspond to usage on the plateform after 2015. The current usage metrics is available 48-96 hours after online publication and is updated daily on week days.
Initial download of the metrics may take a while.