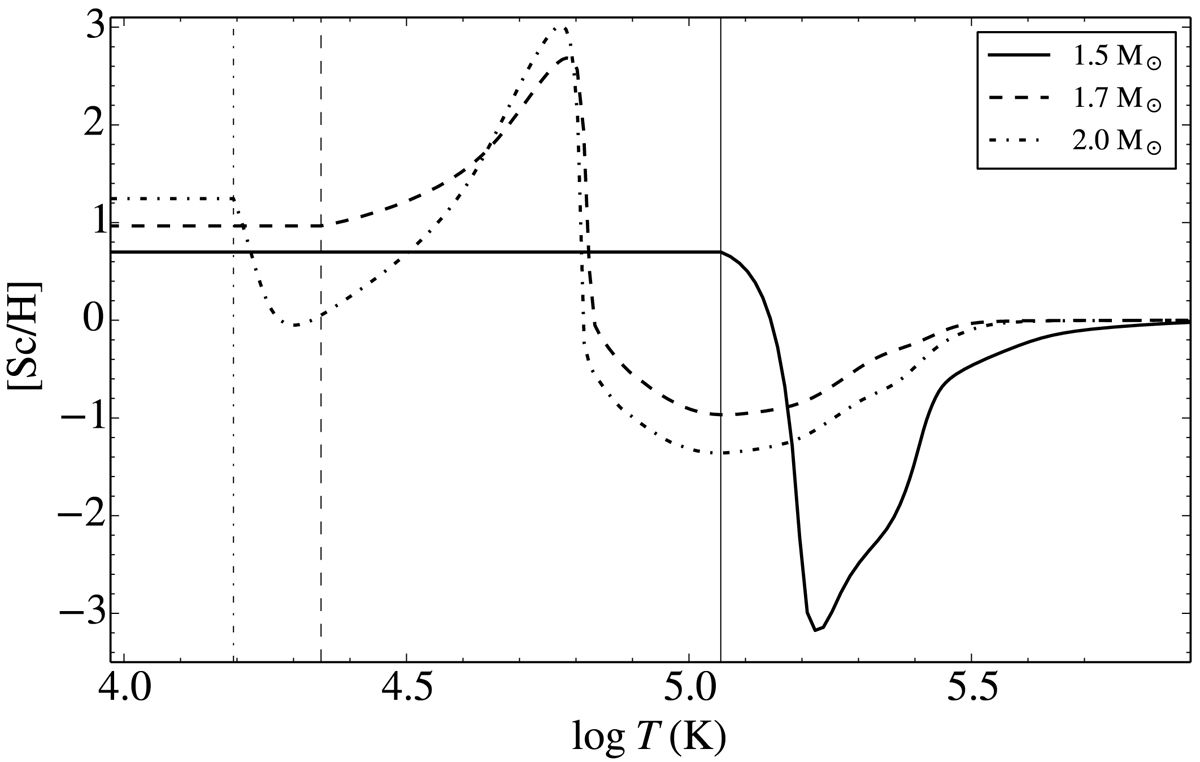
Fig. 3.
Download original image
Abundance of Sc vs. log T at the time the SCZ becomes stable for the 1.5 (solid curve), 1.7 (dashed curve), and 2 M⊙ (dash-dotted curve) models, expressed as the difference between the logarithm of the current ratio to H in number fraction and the corresponding initial value. The vertical lines with the same curve style denote the location of the bottom of the surface convective zone. These results are for models with convection as the unique mixing process and with no mass loss.
Current usage metrics show cumulative count of Article Views (full-text article views including HTML views, PDF and ePub downloads, according to the available data) and Abstracts Views on Vision4Press platform.
Data correspond to usage on the plateform after 2015. The current usage metrics is available 48-96 hours after online publication and is updated daily on week days.
Initial download of the metrics may take a while.