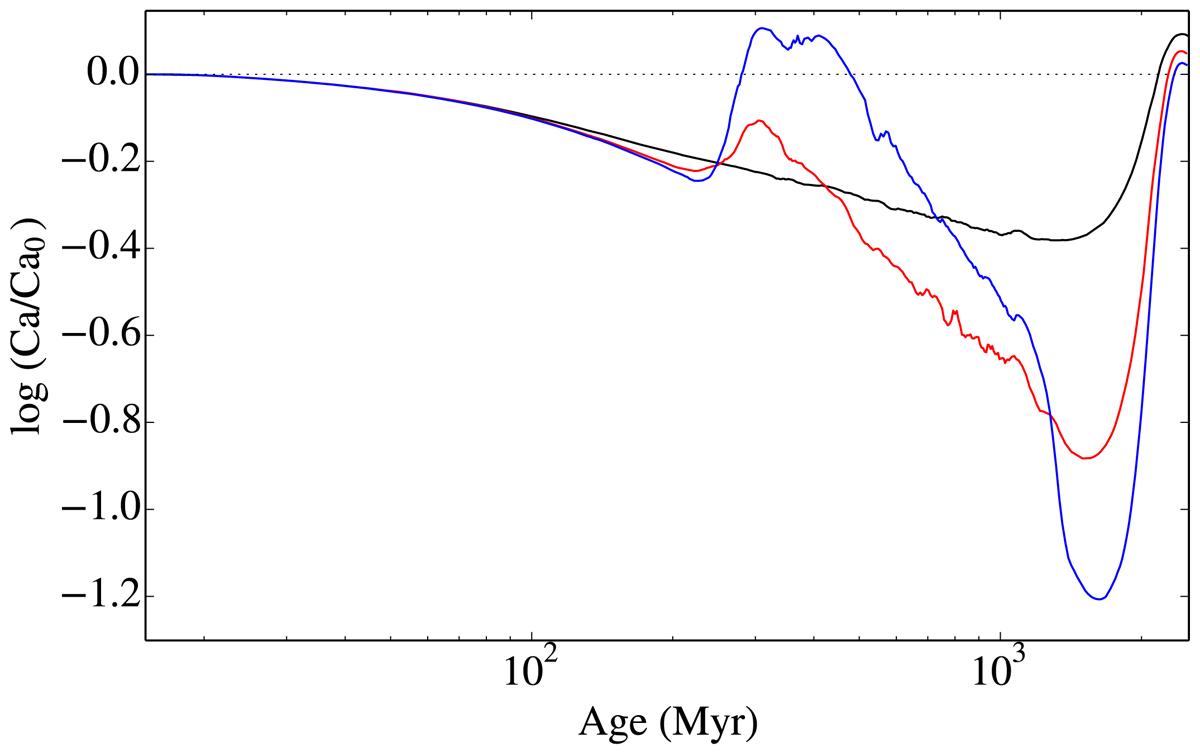
Fig. 2.
Download original image
Evolution with time of the superficial abundance of Ca for the 1.5 M⊙ model with various mass-loss rates (10−13, 3.1 × 10⁻¹⁴, and 10−14 M⊙ yr−1, shown by the black, red, and blue curves, respectively). The abundances are expressed as the logarithm of the ratio of the current mass fraction and the initial one. The thin dotted curve represents the initial abundance.
Current usage metrics show cumulative count of Article Views (full-text article views including HTML views, PDF and ePub downloads, according to the available data) and Abstracts Views on Vision4Press platform.
Data correspond to usage on the plateform after 2015. The current usage metrics is available 48-96 hours after online publication and is updated daily on week days.
Initial download of the metrics may take a while.