Fig. 1.
Download original image
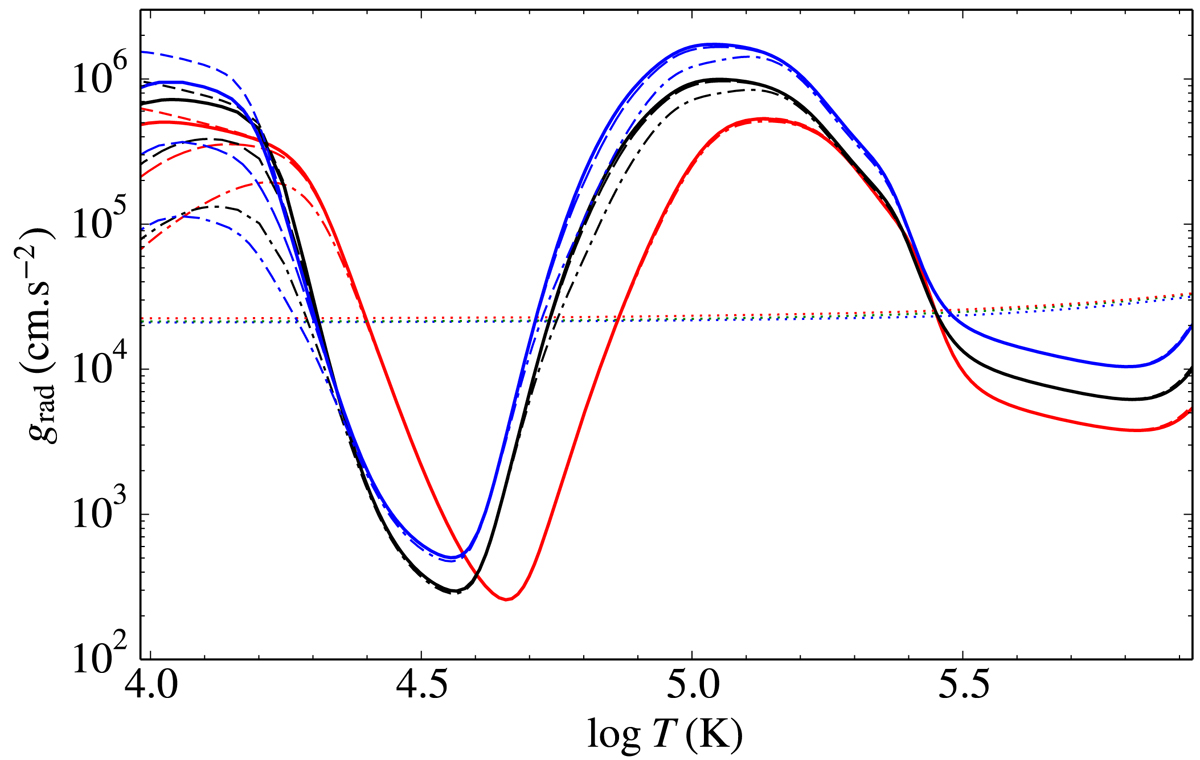
Radiative accelerations for Sc vs. log T at the beginning of the MS for a chemically homogeneous 1.5, 1.7, and 2 M⊙ model (red, black, and blue sets of curves, respectively). For each mass, the short-dashed, long-dashed, and dash-dotted curves show the grad for an abundance one-tenth, ten times, and a hundred times the solar value respectively. The dotted curves denote the local gravity.
Current usage metrics show cumulative count of Article Views (full-text article views including HTML views, PDF and ePub downloads, according to the available data) and Abstracts Views on Vision4Press platform.
Data correspond to usage on the plateform after 2015. The current usage metrics is available 48-96 hours after online publication and is updated daily on week days.
Initial download of the metrics may take a while.