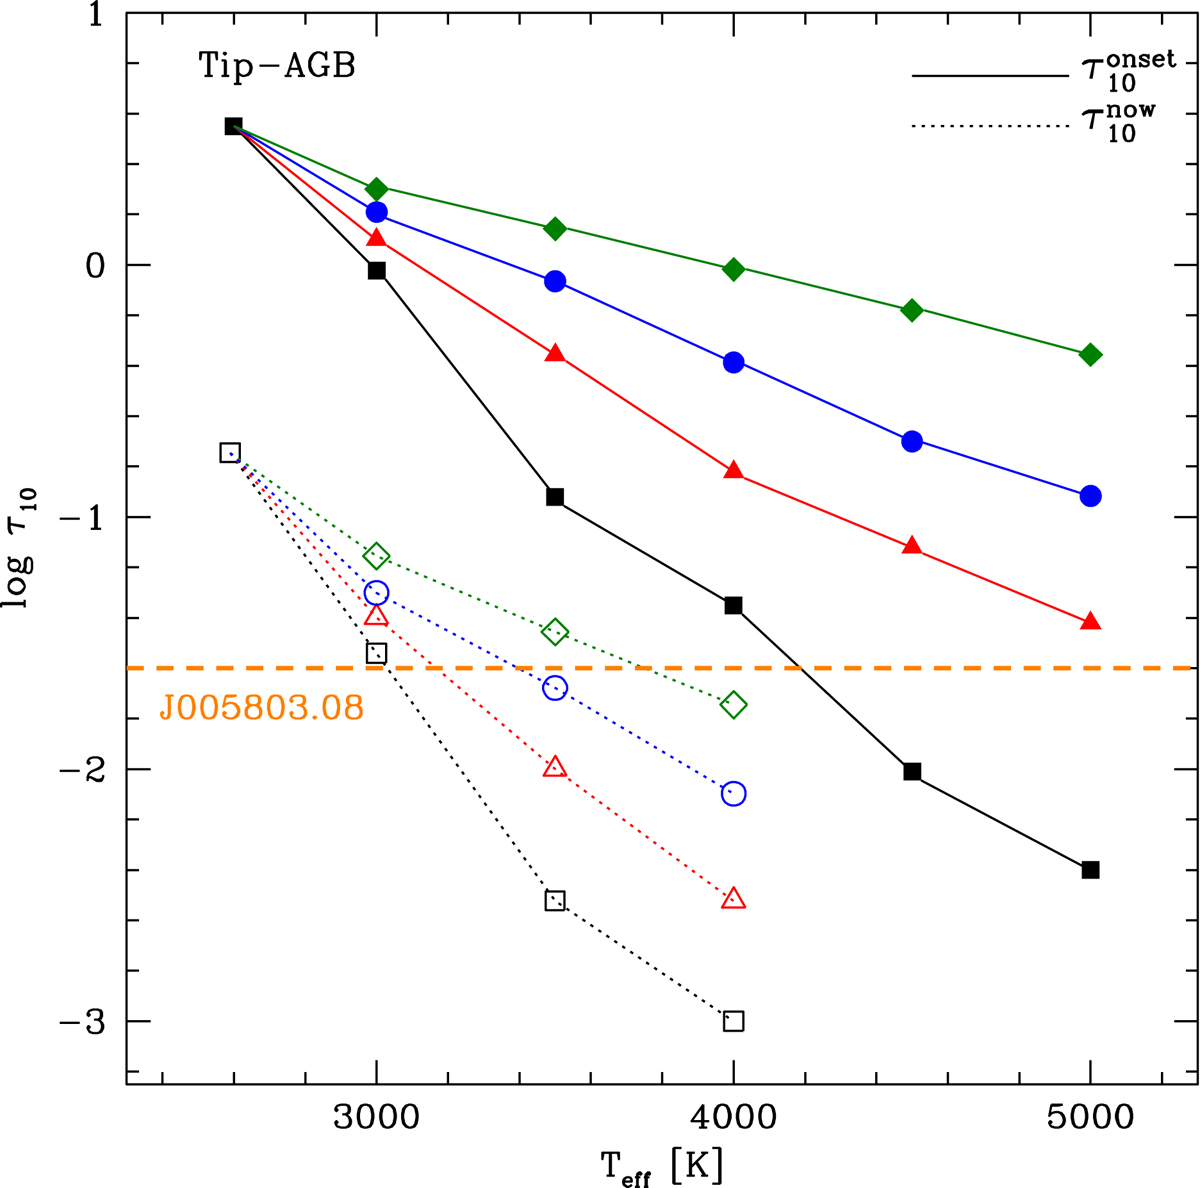
Fig. 11.

Download original image
Solid lines and full points indicate the values of the optical depth ![]() that characterize dust production at the tip of the AGB and during different phases along the contraction sequence of a 2.5 M⊙ model star (see text for details). The colours used correspond to different treatments of mass loss, following the same colour coding as in Fig. 10. Dotted lines and open symbols indicate the values of the optical depth
that characterize dust production at the tip of the AGB and during different phases along the contraction sequence of a 2.5 M⊙ model star (see text for details). The colours used correspond to different treatments of mass loss, following the same colour coding as in Fig. 10. Dotted lines and open symbols indicate the values of the optical depth ![]() that would characterize the dust responsible for the IR excess observed nowadays, at the effective temperature of J005803.08 (6500 K), under the assumption that it was released while the star was evolving through the evolutionary stages with the effective temperatures reported on the abscissa. The dashed orange line represents the optical depth obtained for J005803.08 from SED fitting.
that would characterize the dust responsible for the IR excess observed nowadays, at the effective temperature of J005803.08 (6500 K), under the assumption that it was released while the star was evolving through the evolutionary stages with the effective temperatures reported on the abscissa. The dashed orange line represents the optical depth obtained for J005803.08 from SED fitting.
Current usage metrics show cumulative count of Article Views (full-text article views including HTML views, PDF and ePub downloads, according to the available data) and Abstracts Views on Vision4Press platform.
Data correspond to usage on the plateform after 2015. The current usage metrics is available 48-96 hours after online publication and is updated daily on week days.
Initial download of the metrics may take a while.


