Fig. 10.

Download original image
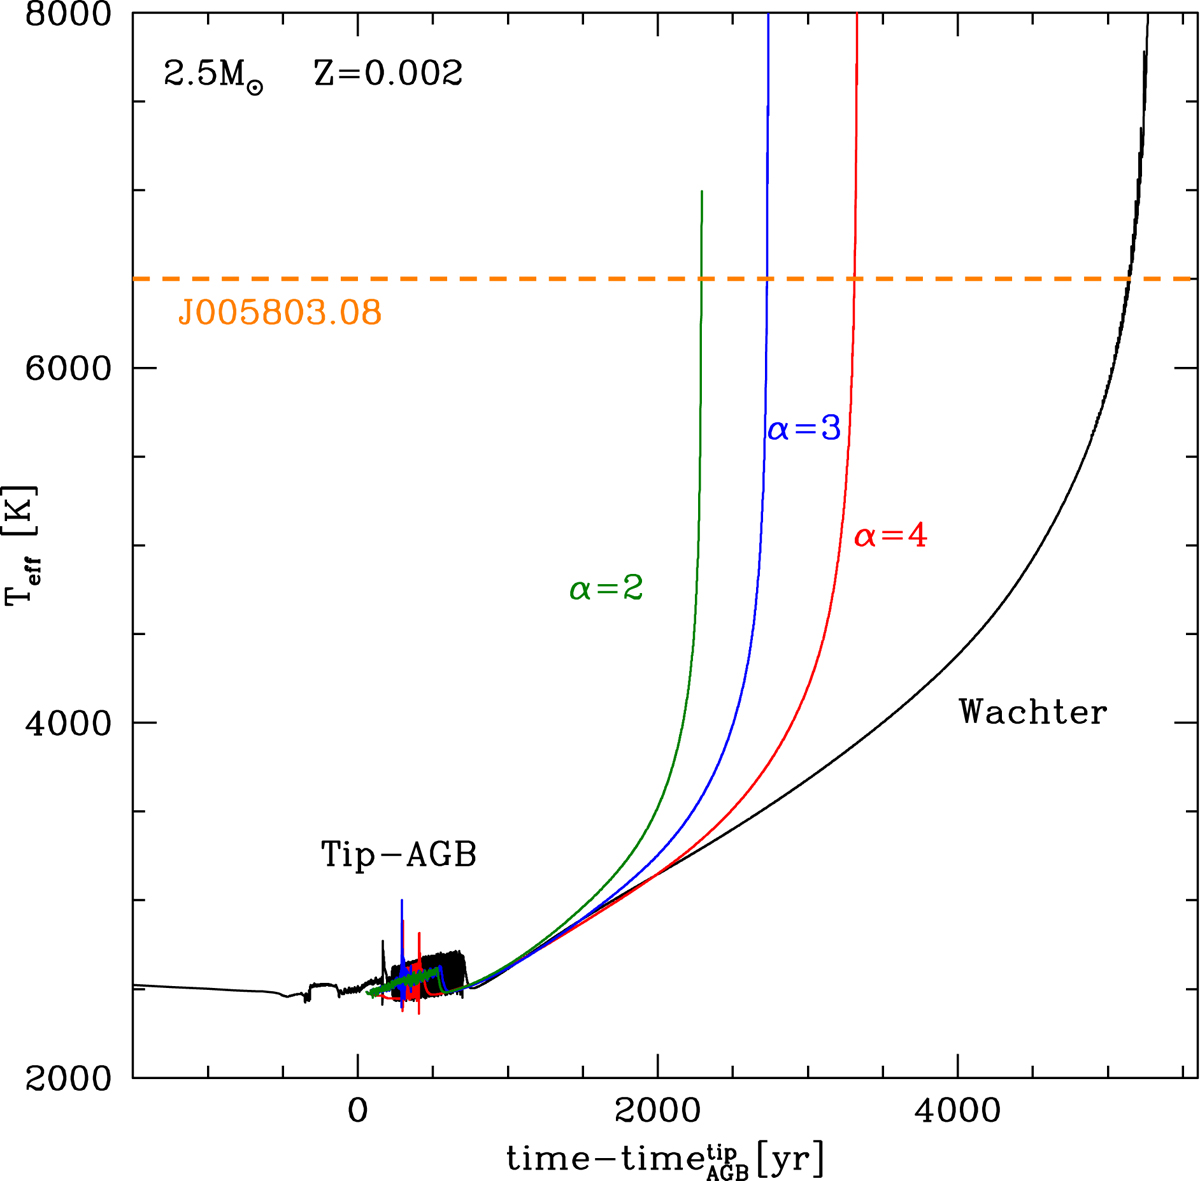
Time variation in the effective temperature of a 2.5 M⊙ model star during the transition from the AGB to the post-AGB phase. Times are counted since the beginning of contraction. The black line indicates the standard result, obtained by adopting the prescription from Wachter et al. (2002, 2008) for mass loss. Coloured tracks refer to results obtained by assuming that Ṁ decreases as ![]() , with α = 2 (green), 3 (blue) and 4 (red). The dashed orange line indicates the effective temperature of J005803.08 given in K14 and K15.
, with α = 2 (green), 3 (blue) and 4 (red). The dashed orange line indicates the effective temperature of J005803.08 given in K14 and K15.
Current usage metrics show cumulative count of Article Views (full-text article views including HTML views, PDF and ePub downloads, according to the available data) and Abstracts Views on Vision4Press platform.
Data correspond to usage on the plateform after 2015. The current usage metrics is available 48-96 hours after online publication and is updated daily on week days.
Initial download of the metrics may take a while.


