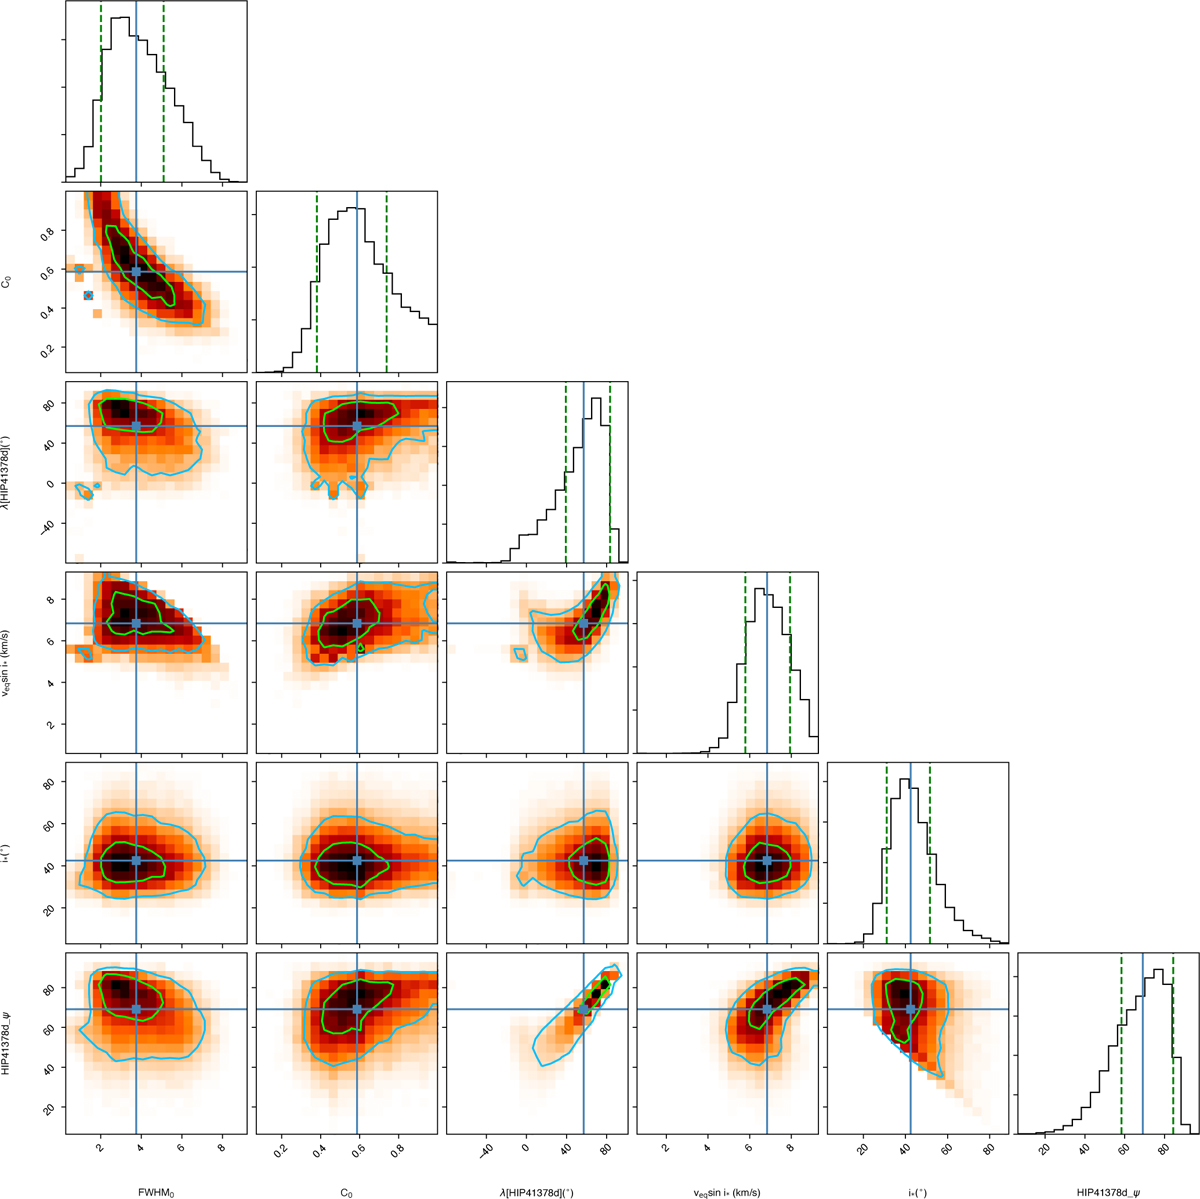
Fig. A.4
Download original image
Correlation diagrams for the PDFs of the RM Revolutions model parameters: the FWHM, C0, λ, and υ sin i⋆, as well as the inferred parameters i* and Ψ. Green and blue lines show the 1 and 2σ simultaneous 2D confidence regions that contain 39.3% and 86.5% of the accepted steps, respectively. One-dimensional histograms correspond to the distributions projected on the space of each line parameter, with the green dashed lines limiting the 68.3% highest density intervals. The blue lines and squares show the median values. A high-resolution plot can be provided upon request.
Current usage metrics show cumulative count of Article Views (full-text article views including HTML views, PDF and ePub downloads, according to the available data) and Abstracts Views on Vision4Press platform.
Data correspond to usage on the plateform after 2015. The current usage metrics is available 48-96 hours after online publication and is updated daily on week days.
Initial download of the metrics may take a while.