Fig. 2
Download original image
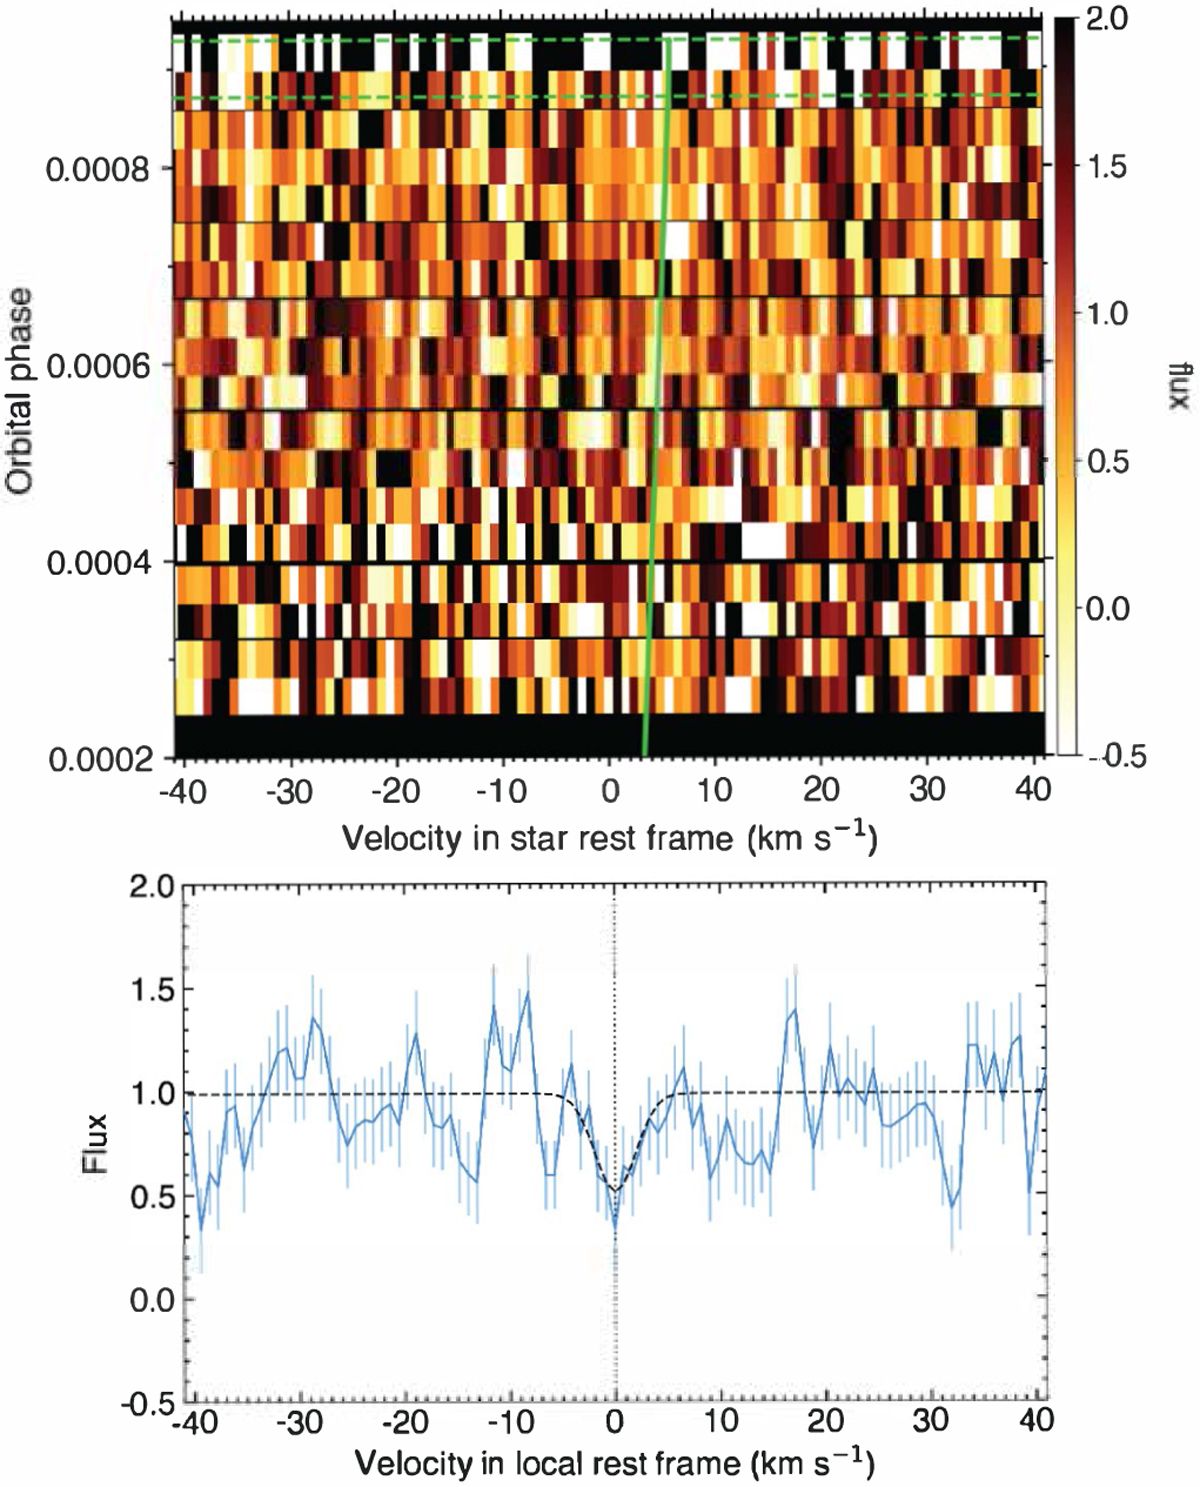
Result of the RM Revolutions analysis. Top panel: map of the CCFintr during the 2019 transit of HIP41378 d. The core of the stellar line from the planet-occulted regions is faintly visible as a brighter streak along the green line, which shows the stellar surface RV model from the RM Revolutions best fit. Egress transit contacts are shown as green dashed lines. Values are coloured as a function of the flux and plotted as a function of RV in the star rest frame (in abscissa) and orbital phase (in ordinate). Bottom panel: average of in-transit CCFintr, after they were shifted to a common rest frame using the surface RV model. The dashed profile is the stellar line model from the RM Revolutions best fit.
Current usage metrics show cumulative count of Article Views (full-text article views including HTML views, PDF and ePub downloads, according to the available data) and Abstracts Views on Vision4Press platform.
Data correspond to usage on the plateform after 2015. The current usage metrics is available 48-96 hours after online publication and is updated daily on week days.
Initial download of the metrics may take a while.