Fig. 2
Download original image
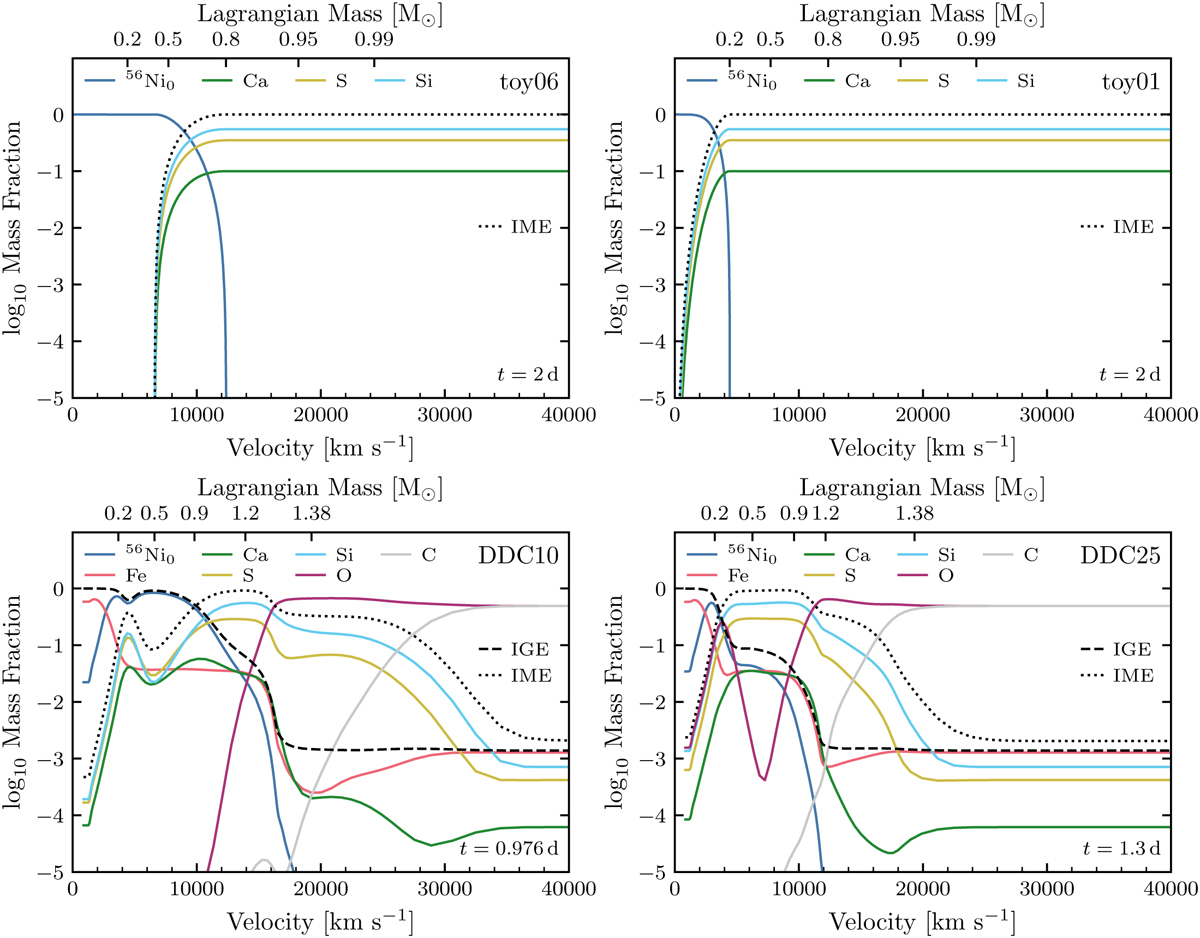
Composition profiles at the start of our simulations in our model set (2 days post explosion for the toy models and ~1 day post explosion for the DDC models). For the toy models, this represents the full set of species present (56Ni and decay products 56Co and 56Fe, as well as IMEs: Ca S, Si), while for the DDC models only a subset of species are shown for illustration. The 56Ni mass fraction is given at the time of explosion. We also show the total IGE mass fraction (from Sc to Ni; dashed line) and the total IME mass fraction (from Na to Ca; dotted line). The total IGE mass fraction coincides with the 56Ni0 line in the toy models and is not shown for sake of clarity.
Current usage metrics show cumulative count of Article Views (full-text article views including HTML views, PDF and ePub downloads, according to the available data) and Abstracts Views on Vision4Press platform.
Data correspond to usage on the plateform after 2015. The current usage metrics is available 48-96 hours after online publication and is updated daily on week days.
Initial download of the metrics may take a while.