Open Access
Fig. 12
Download original image
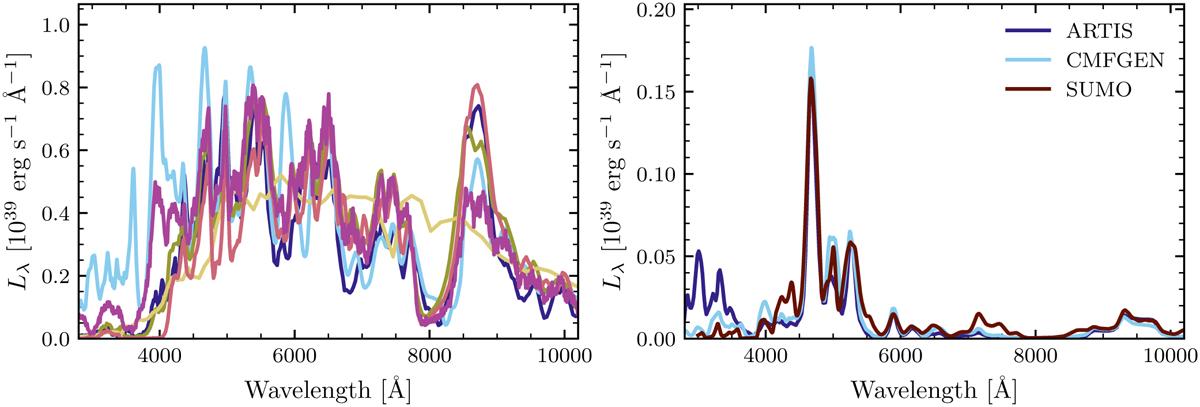
Spectra at 50 days and 200 days post explosion for the toy06 model. The colour coding for the 50 days spectra is the same as in Fig. 11 and is not repeated here for sake of clarity.
Current usage metrics show cumulative count of Article Views (full-text article views including HTML views, PDF and ePub downloads, according to the available data) and Abstracts Views on Vision4Press platform.
Data correspond to usage on the plateform after 2015. The current usage metrics is available 48-96 hours after online publication and is updated daily on week days.
Initial download of the metrics may take a while.