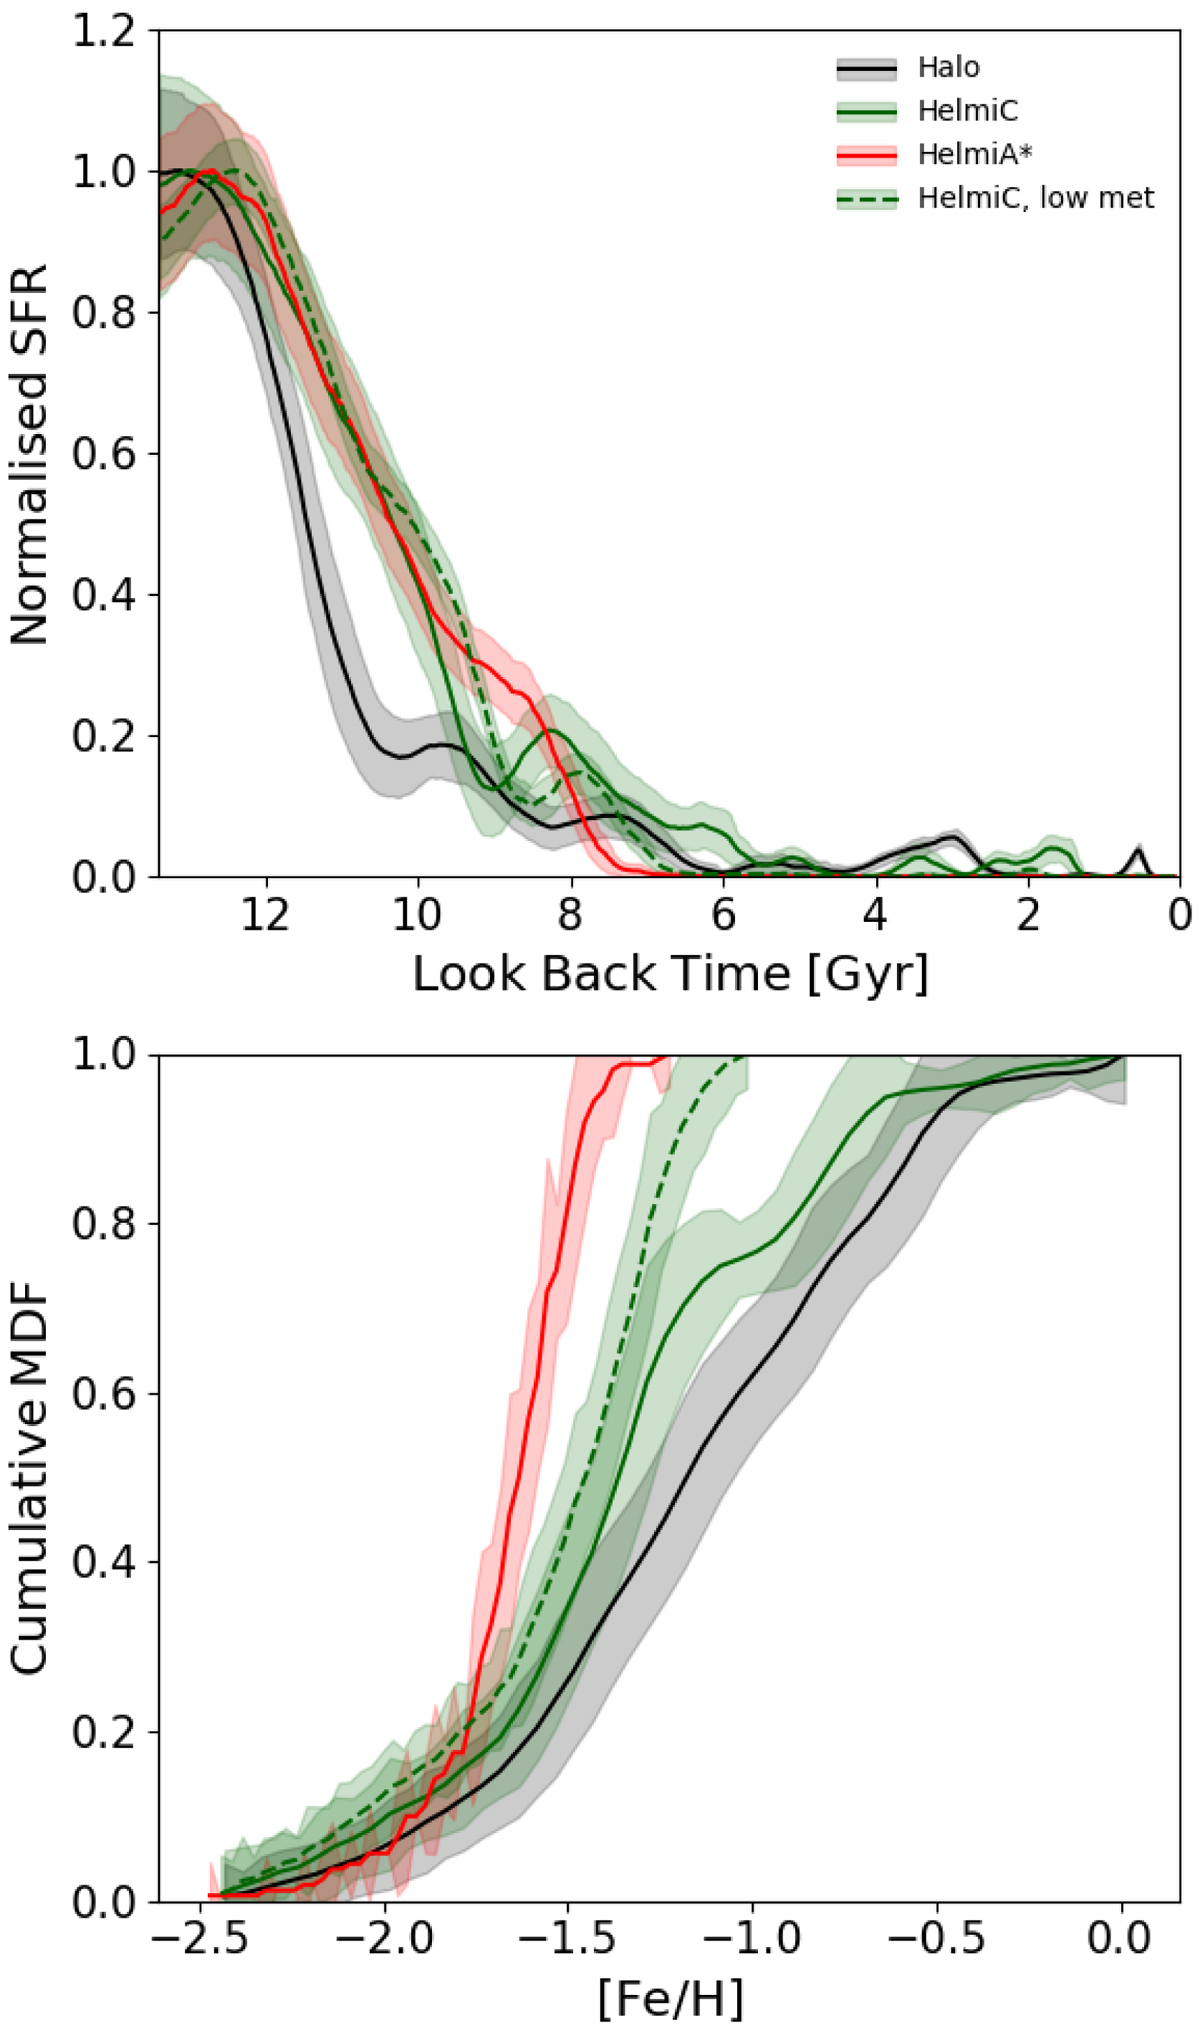
Fig. 4.
Download original image
Comparison of the SFHs of the HelmiC (in green) and HelmiA* (in red) subsets with that of the local retrograde halo sample (black). Top: normalised star formation rate as a function of age. Bottom: cumulative metallicity distribution function (MDF). The SFHs in the upper panel have been normalised to their peak value. Note the slightly larger uncertainties for the HelmiA* subset, which are due to its smaller size. For HelmiA* (and the HelmiC-low met subset in the dashed green line), we restrict the comparison to the population with [Fe/H] ≤ − 1.0 (to remove the contamination by the disc).
Current usage metrics show cumulative count of Article Views (full-text article views including HTML views, PDF and ePub downloads, according to the available data) and Abstracts Views on Vision4Press platform.
Data correspond to usage on the plateform after 2015. The current usage metrics is available 48-96 hours after online publication and is updated daily on week days.
Initial download of the metrics may take a while.