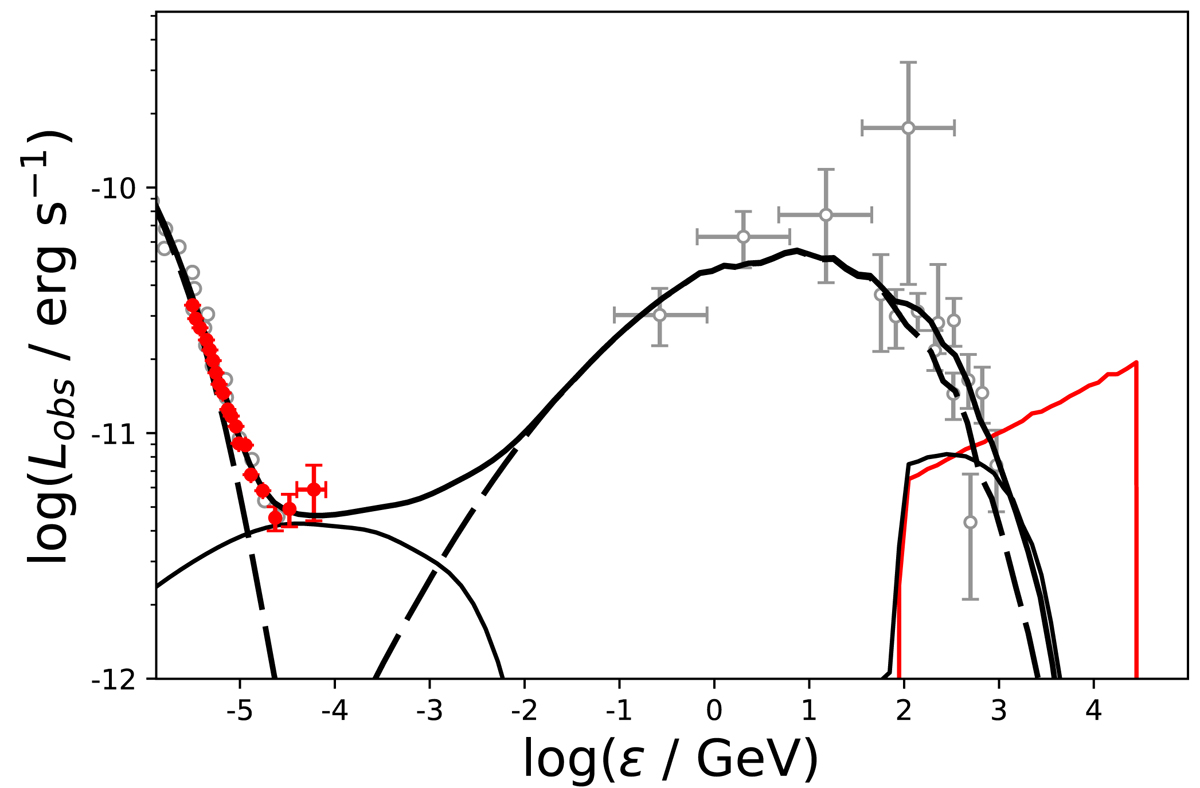
Fig. 6.
Download original image
X-ray and γ-ray spectrum of Mrk 421 with the visible excess at hard X-rays (red circles with error bars; data from Kataoka & Stawarz 2016). The primary γ-rays are injected into the jet (solid red line) with the spectrum observed in the misaligned blazar IC 310 (Aleksić et al. 2014). The secondary emission from the cascades is shown with the thin black line (in the X-ray and HE γ-ray range). The emission from the stationary jet is presented with the thick dashed line. The total emission from the jet is represented by the thick solid line. The gray circles show the spectral energy distribution of Mrk 421 observed at 56302 MJD by Baloković et al. (2016). The parameters of the extended jet model are reported in Table 1.
Current usage metrics show cumulative count of Article Views (full-text article views including HTML views, PDF and ePub downloads, according to the available data) and Abstracts Views on Vision4Press platform.
Data correspond to usage on the plateform after 2015. The current usage metrics is available 48-96 hours after online publication and is updated daily on week days.
Initial download of the metrics may take a while.