Fig. 8
Download original image
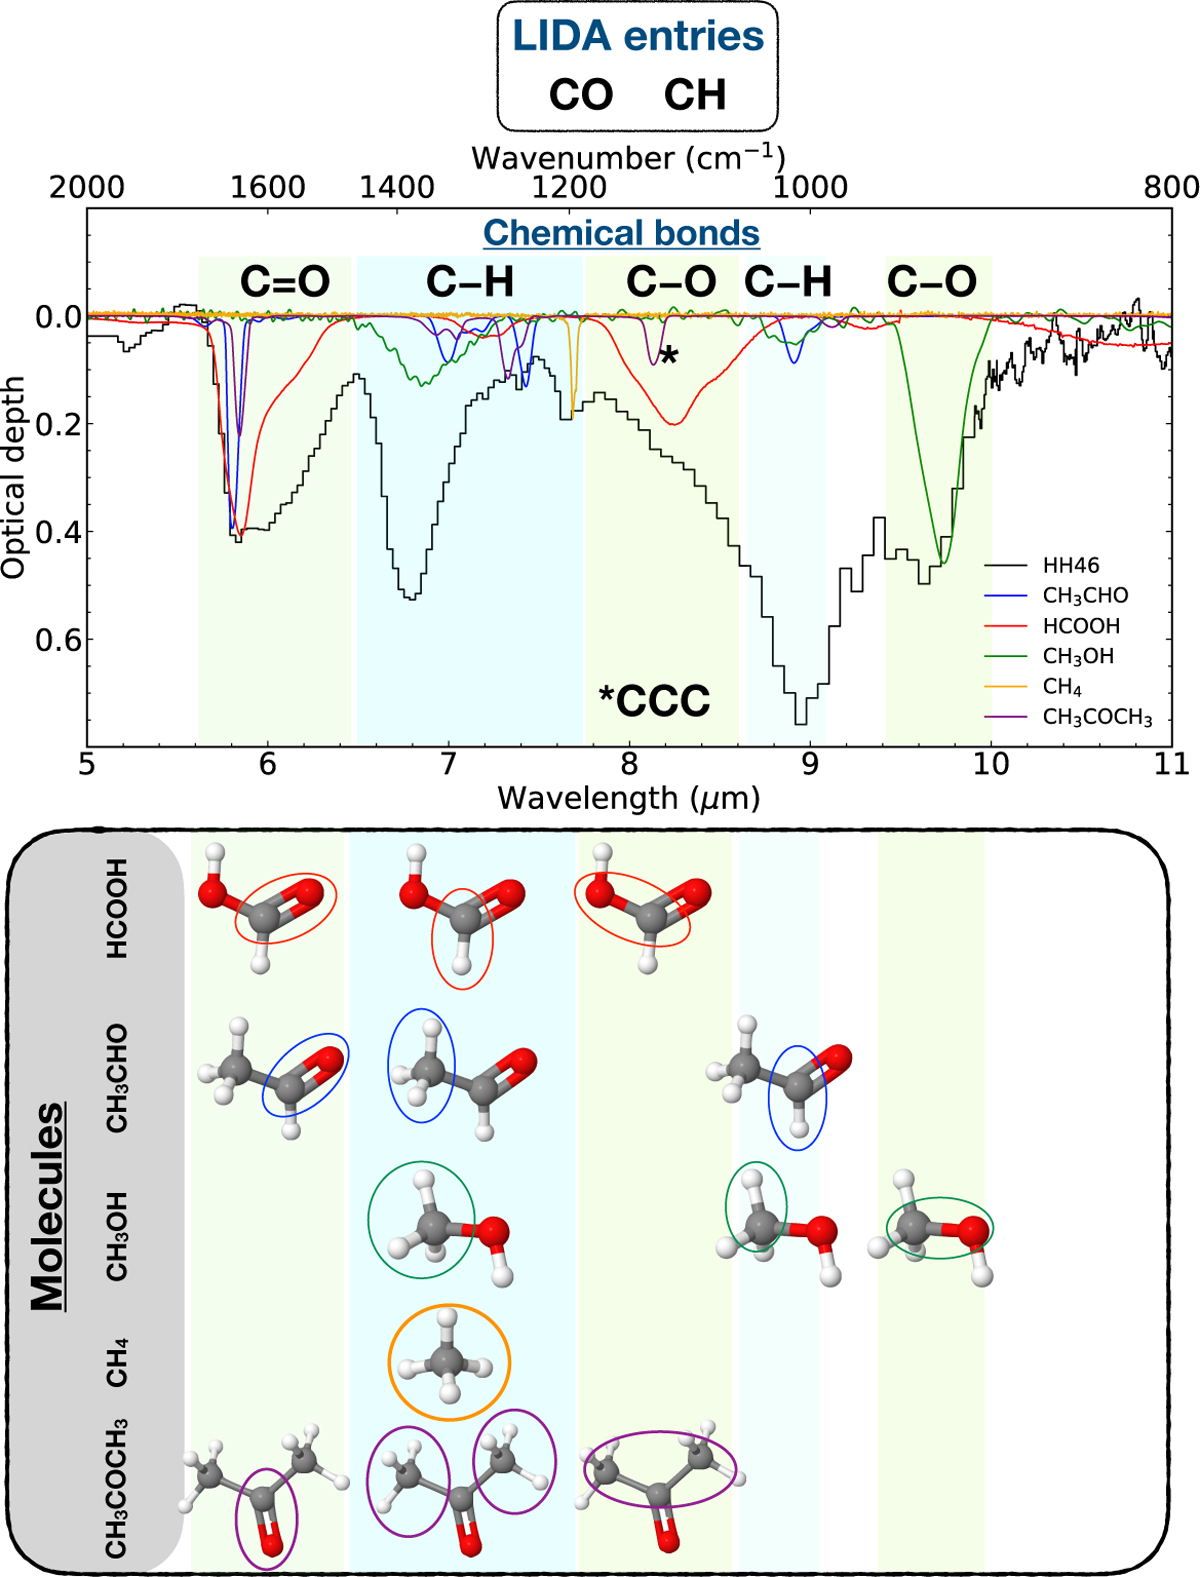
Illustration on how to use LIDA to interpret astronomical observations. Top: LIDA entries to search for molecules sharing CO and CH chemical bonds. Middle: selected experimental data scaled to the water-silicate-subtracted spectra of the protostar HH46. Bottom: molecules representing the pure ices used to match the HH46 spectrum. The ellipses indicate which part of a molecule is responsible for a specific absorption band, and the colors follow the same color-code used in the middle panel.
Current usage metrics show cumulative count of Article Views (full-text article views including HTML views, PDF and ePub downloads, according to the available data) and Abstracts Views on Vision4Press platform.
Data correspond to usage on the plateform after 2015. The current usage metrics is available 48-96 hours after online publication and is updated daily on week days.
Initial download of the metrics may take a while.