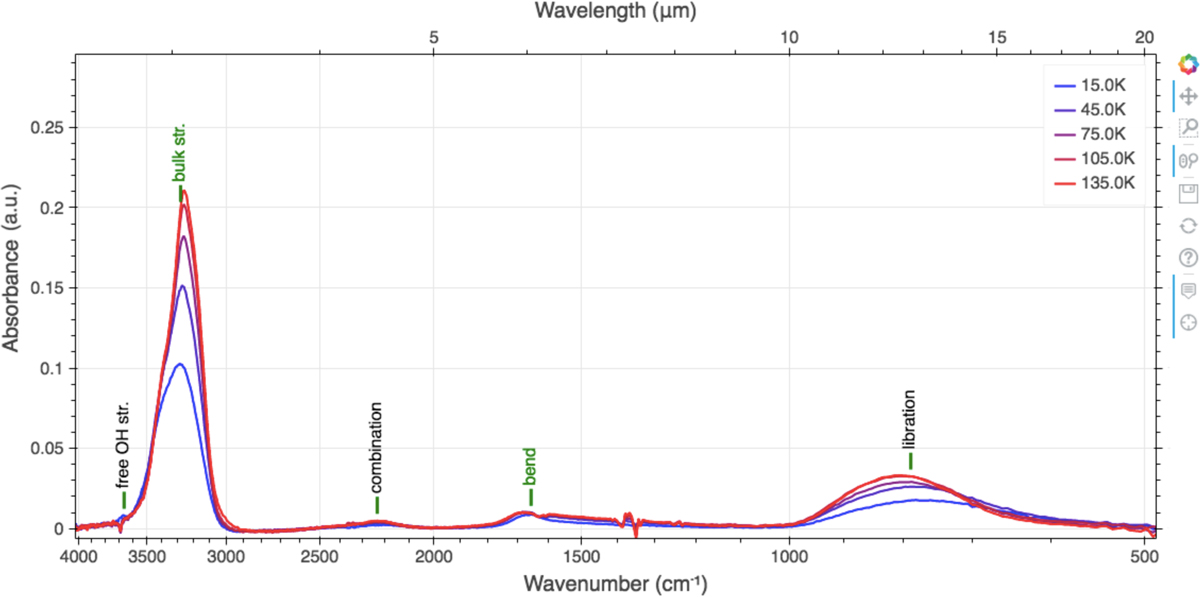
Fig. 3
Download original image
Screenshot of spectrum visualization window showing IR spectrum of H2O ice at different temperatures given by the color-code. The annotations of the water vibrational modes are shown in green. They can be hidden by clicking on the yellow toggle below the plot. It also describes the annotation color-code; green means the vibrational mode is calculated, and black indicates the vibrational mode is not calculated. The hover set at the position around 3000 cm−1 displays the information of the spectral data point, such as the wave number in cm−1 (bottom X-axis), wavelength in µm (top X-axis), and absorbance (Y-axis). The toolbar is placed on the right side of the plot.
Current usage metrics show cumulative count of Article Views (full-text article views including HTML views, PDF and ePub downloads, according to the available data) and Abstracts Views on Vision4Press platform.
Data correspond to usage on the plateform after 2015. The current usage metrics is available 48-96 hours after online publication and is updated daily on week days.
Initial download of the metrics may take a while.