Fig. C.1
Download original image
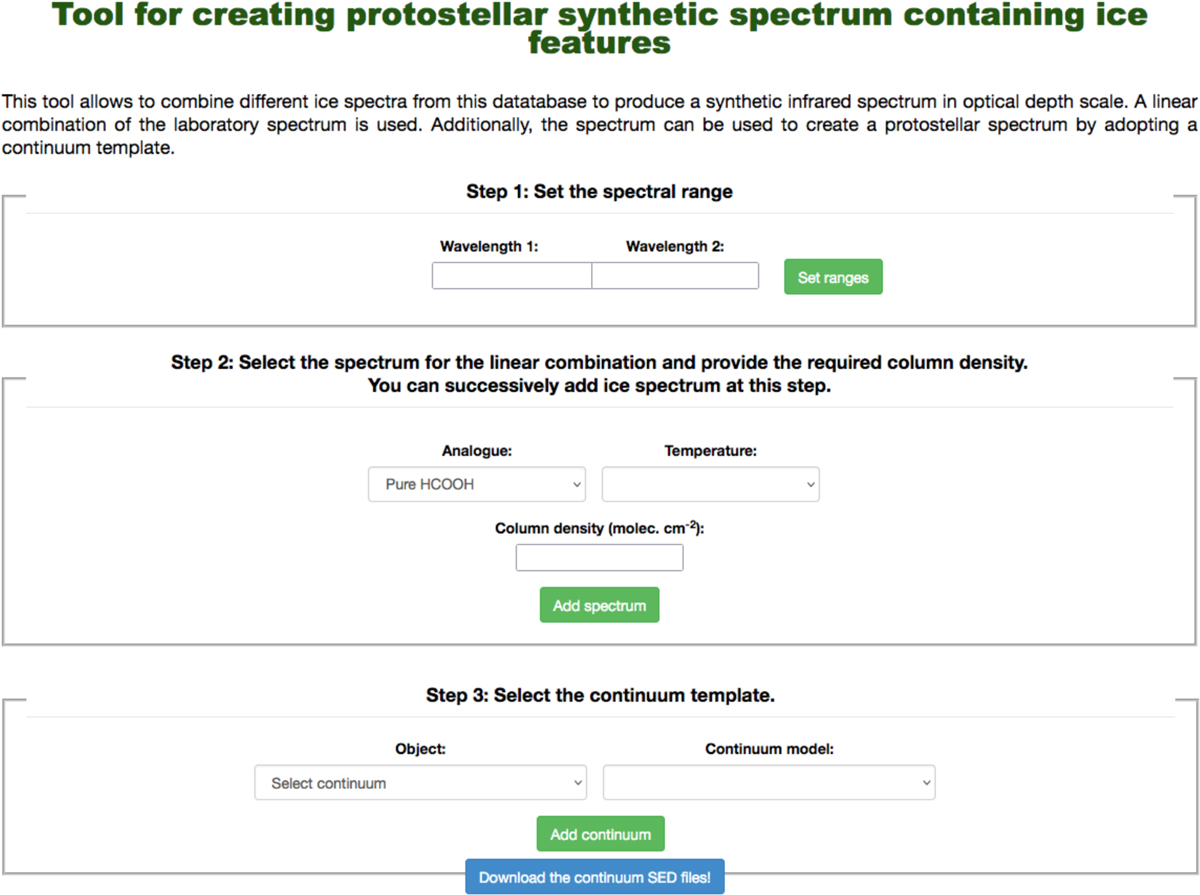
Screenshot of web interface of SPECFY showing the three steps to create a synthetic protostar spectrum. The green buttons submit the information added to the white rectangles. In steps 2 and 3, the user can scroll and search for ice analogs and temperatures, and for continuum models, respectively. The blue button allows the user to download the continuum SED files.
Current usage metrics show cumulative count of Article Views (full-text article views including HTML views, PDF and ePub downloads, according to the available data) and Abstracts Views on Vision4Press platform.
Data correspond to usage on the plateform after 2015. The current usage metrics is available 48-96 hours after online publication and is updated daily on week days.
Initial download of the metrics may take a while.