Fig. 1
Download original image
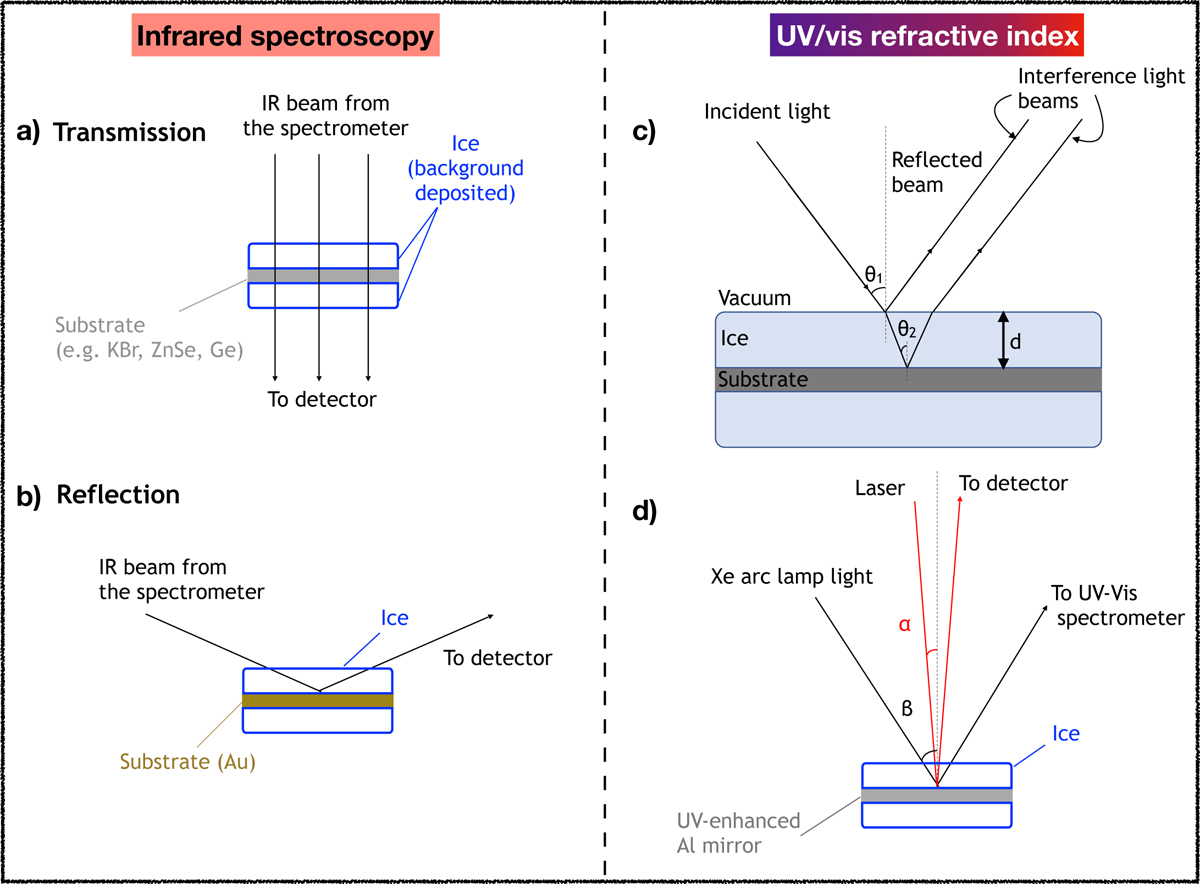
Overview of experimental techniques used to obtain data hosted in LIDA. The left panel shows two infrared spectroscopic techniques used to record the spectrum of ices; namely, transmission mode (a) and reflection-absorption mode (b). The right panel illustrates the technique used to measure UV/vis refractive index values. Cartoon c provides details of the diffraction and reflection phenomena that generate an interference pattern during ice growth. Cartoon d shows the incidence and reflection of the monochromatic and broadband light beams when interacting with the ice.
Current usage metrics show cumulative count of Article Views (full-text article views including HTML views, PDF and ePub downloads, according to the available data) and Abstracts Views on Vision4Press platform.
Data correspond to usage on the plateform after 2015. The current usage metrics is available 48-96 hours after online publication and is updated daily on week days.
Initial download of the metrics may take a while.