Open Access
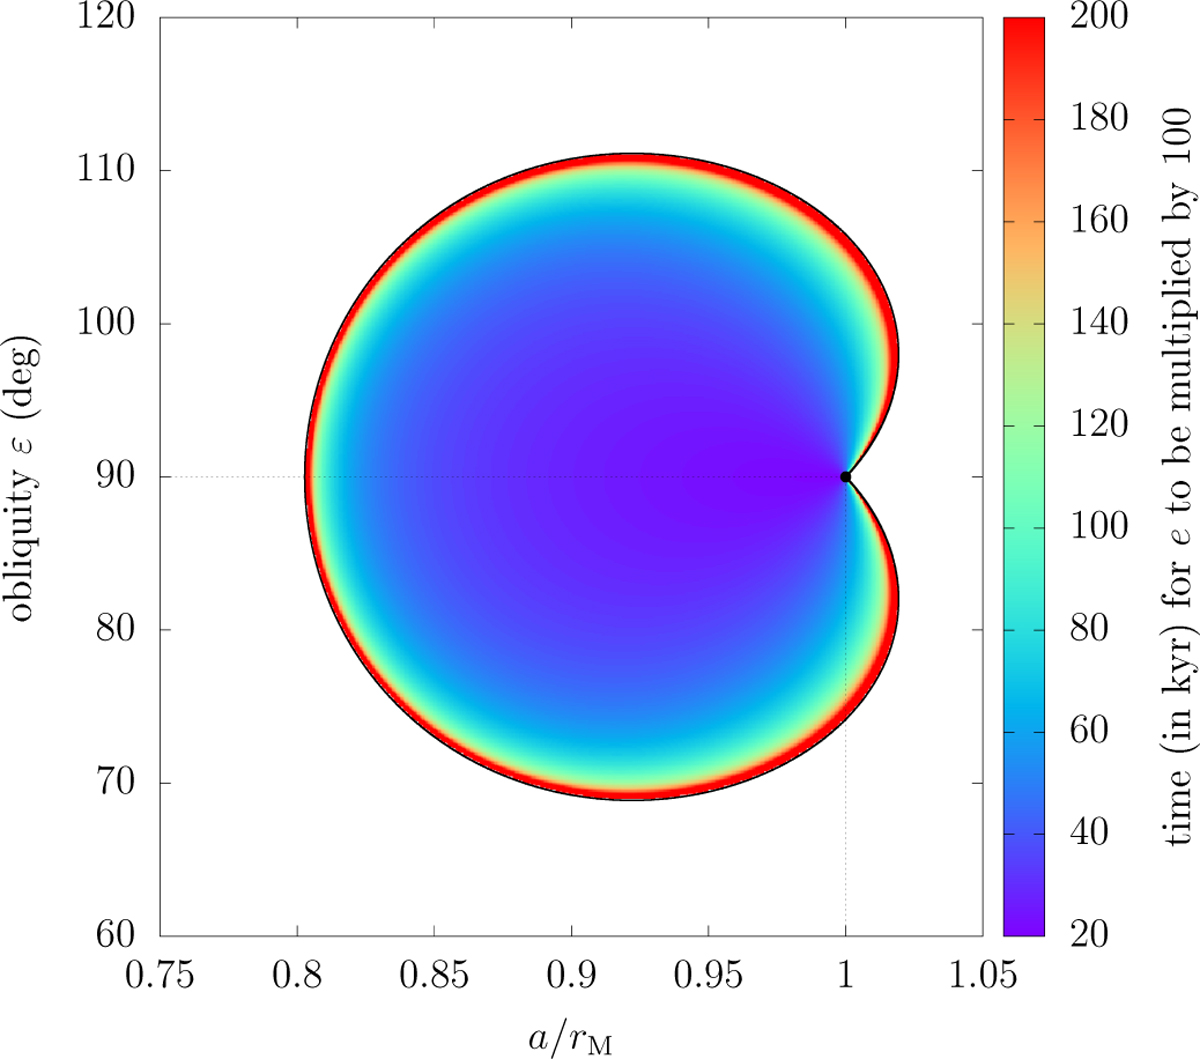
Fig. 7
Download original image
Timescale of the satellite’s eccentricity increase when the system becomes unstable. The colour scale shows the time needed for the eccentricity to be multiplied by a factor 100, as computed from the equations linearised at the unstable equilibrium point (see Tremaine et al. 2009; Saillenfest & Lari 2021).
Current usage metrics show cumulative count of Article Views (full-text article views including HTML views, PDF and ePub downloads, according to the available data) and Abstracts Views on Vision4Press platform.
Data correspond to usage on the plateform after 2015. The current usage metrics is available 48-96 hours after online publication and is updated daily on week days.
Initial download of the metrics may take a while.