Fig. 6

Download original image
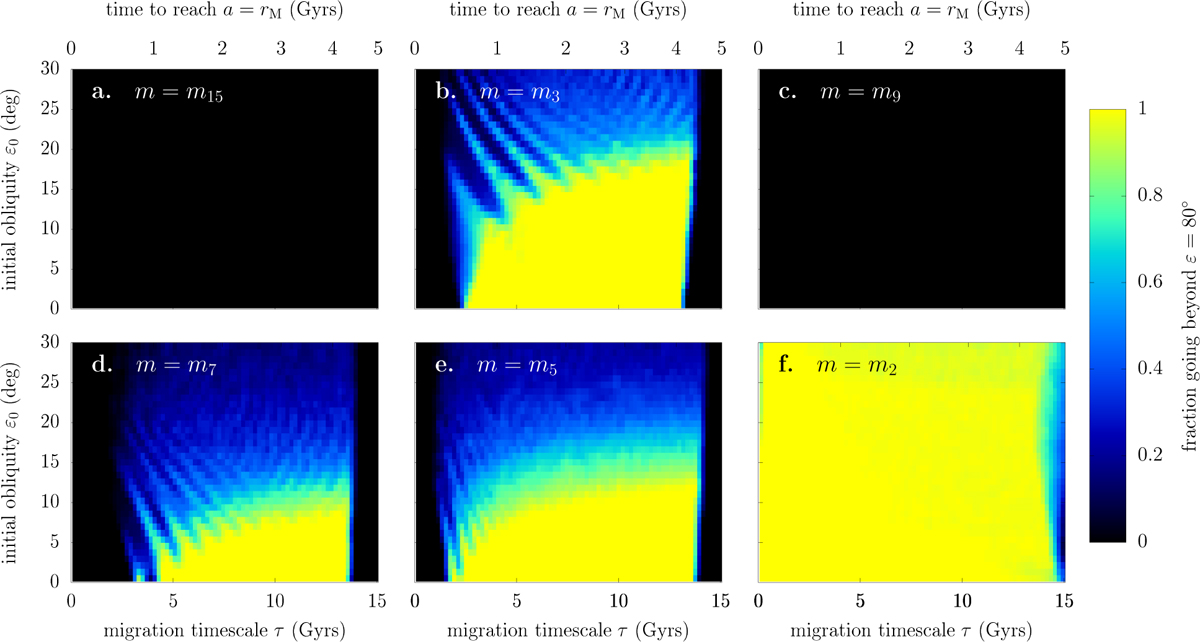
Probability of tilting Uranus as a function of its initial obliquity and the migration velocity of its satellite. On each panel, parameters are sampled on a regular grid, and for each set of parameters, 240 numerical integrations are performed with random initial spin-axis phases ψ ∈ [0, 2π). The colour map shows the fraction of the 240 trajectories that go beyond ε = 80° during the integration. The satellite is initialised at a0 = 0.8 rM and propagated with the migration law in Eq. (9). Numerical integrations are stopped after 4 Gyr or when the satellite goes beyond the limit of the unstable zone. The mass of the satellite is labelled on each panel using the notation of Table 2. The top horizontal axis shows the time required for the satellite to reach a = rM. It can be converted into an effective tidal quality factor Q for Uranus (see Fig. 3).
Current usage metrics show cumulative count of Article Views (full-text article views including HTML views, PDF and ePub downloads, according to the available data) and Abstracts Views on Vision4Press platform.
Data correspond to usage on the plateform after 2015. The current usage metrics is available 48-96 hours after online publication and is updated daily on week days.
Initial download of the metrics may take a while.


