Fig. 17
Download original image
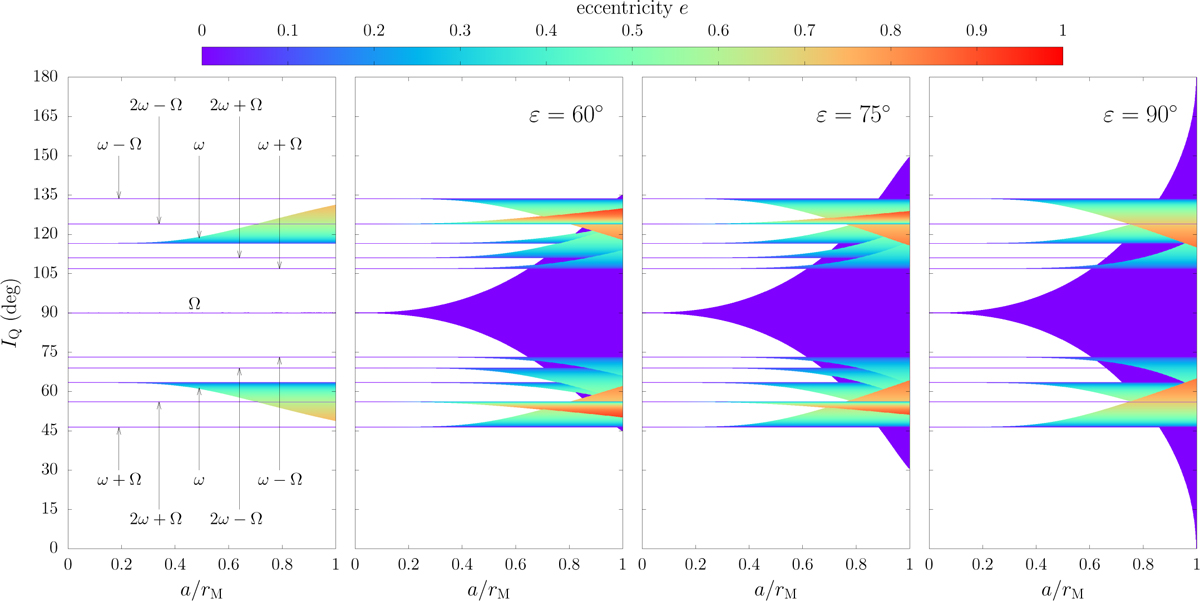
Location and width of first-order secular resonances for the satellite. Each panel is plotted for one fixed value of the planet’s obliquity ε from 0° (left) to 90° (right). Resonances are labelled in the leftmost panel by their respective critical angle ξ (omitting the Q indexes). The coloured intervals show the extremal values of equatorial inclination IQ spanned by the resonance separatrix. Inside each resonance, a conserved quantity links IQ to the eccentricity e, as shown by the colour gradient.
Current usage metrics show cumulative count of Article Views (full-text article views including HTML views, PDF and ePub downloads, according to the available data) and Abstracts Views on Vision4Press platform.
Data correspond to usage on the plateform after 2015. The current usage metrics is available 48-96 hours after online publication and is updated daily on week days.
Initial download of the metrics may take a while.