Fig. 16
Download original image
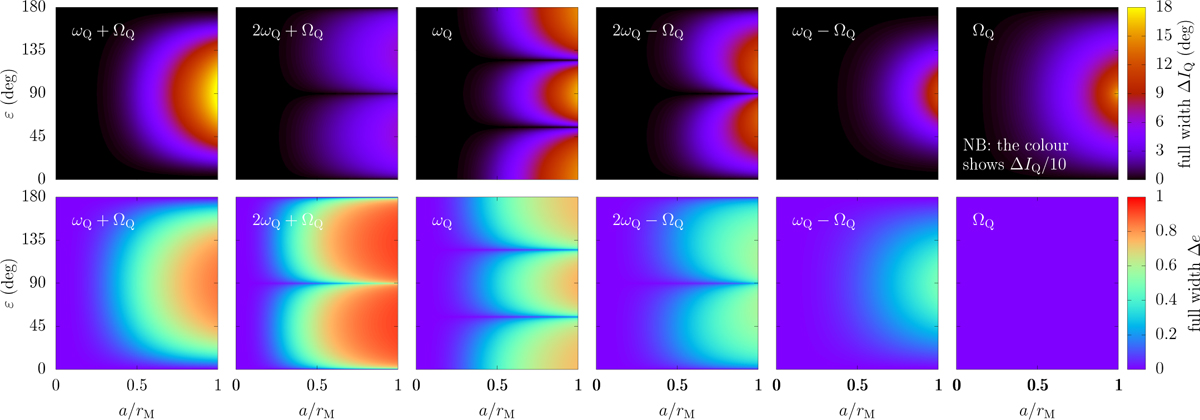
Widths of first-order secular resonances for the satellite as a function of the parameters. Only prograde resonances are shown. The widths of retrograde resonances are obtained by inverting the sign of ΩQ in the titles. For each resonance, the inclination and eccentricity of the satellite are linked through a constant quantity K given in Table 3. The fixed value of K used to plot this figure is given in Appendix E. The colour gradient shows the width of the resonance as measured in inclination (top row) and in eccentricity (bottom row). Because of its overly large ΔIQ, the width displayed in the top right panel is shown divided by 10 (as illustrated in Fig. 17, it reaches 180° at a = rM and ε = 90°).
Current usage metrics show cumulative count of Article Views (full-text article views including HTML views, PDF and ePub downloads, according to the available data) and Abstracts Views on Vision4Press platform.
Data correspond to usage on the plateform after 2015. The current usage metrics is available 48-96 hours after online publication and is updated daily on week days.
Initial download of the metrics may take a while.