Fig. 15
Download original image
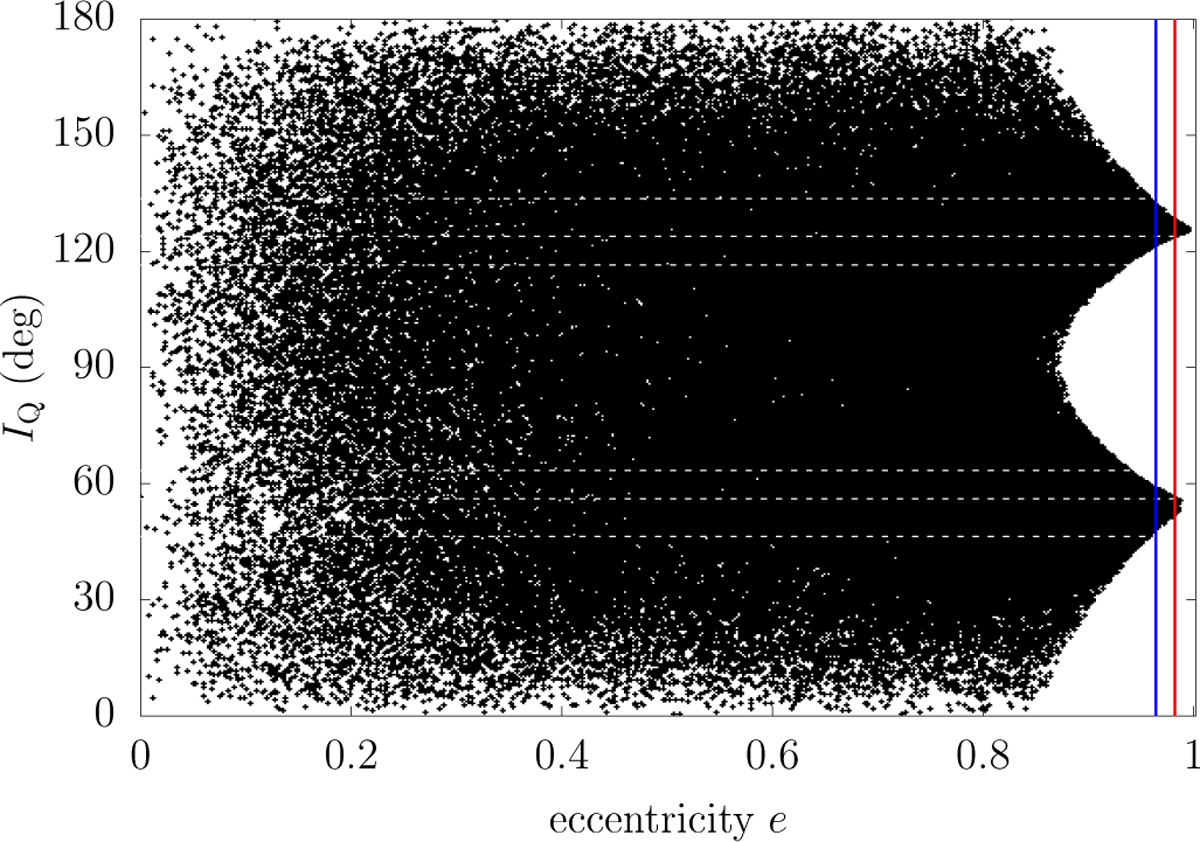
Chaotic region explored by the satellite. The black dots show the track left during 4 Gyr by a single numerical integration. The physical parameters are the same as in Fig. 8. The blue and red vertical lines show the Roche and collision limits, respectively. The white horizontal dashed lines show the locations of the secular resonances that have the largest width in eccentricity (see text).
Current usage metrics show cumulative count of Article Views (full-text article views including HTML views, PDF and ePub downloads, according to the available data) and Abstracts Views on Vision4Press platform.
Data correspond to usage on the plateform after 2015. The current usage metrics is available 48-96 hours after online publication and is updated daily on week days.
Initial download of the metrics may take a while.