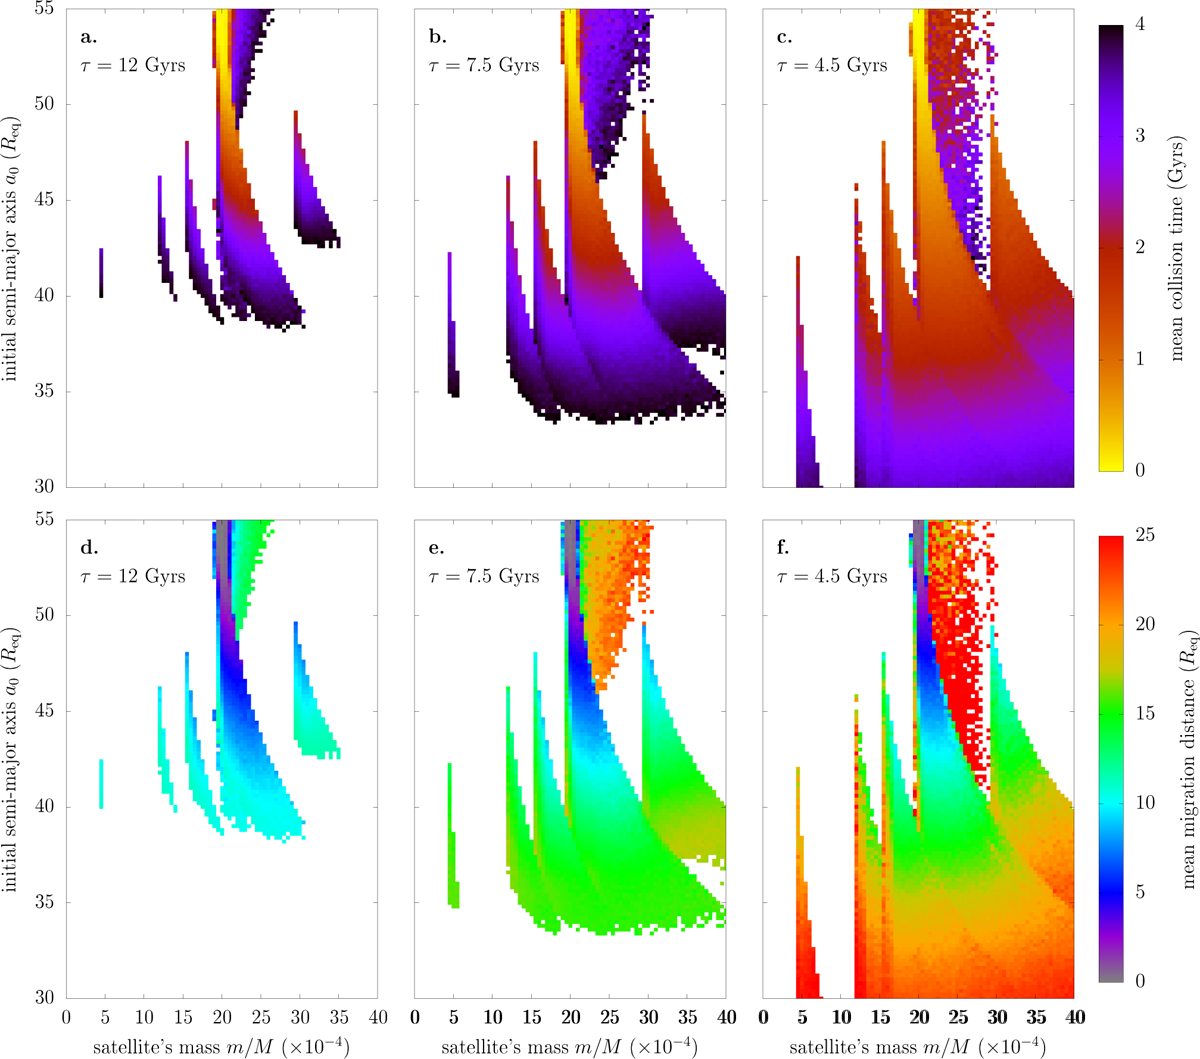
Fig. 13
Download original image
Collision time and migration distance covered by the satellite in the simulations of Fig. 12. Top panels: integration time at collision. Bottom panels: distance covered by the satellite before collision. Similar graphs are obtained when considering the time of crossing the Roche limit (with only slightly smaller integration times and migration distances).
Current usage metrics show cumulative count of Article Views (full-text article views including HTML views, PDF and ePub downloads, according to the available data) and Abstracts Views on Vision4Press platform.
Data correspond to usage on the plateform after 2015. The current usage metrics is available 48-96 hours after online publication and is updated daily on week days.
Initial download of the metrics may take a while.