Fig. 12
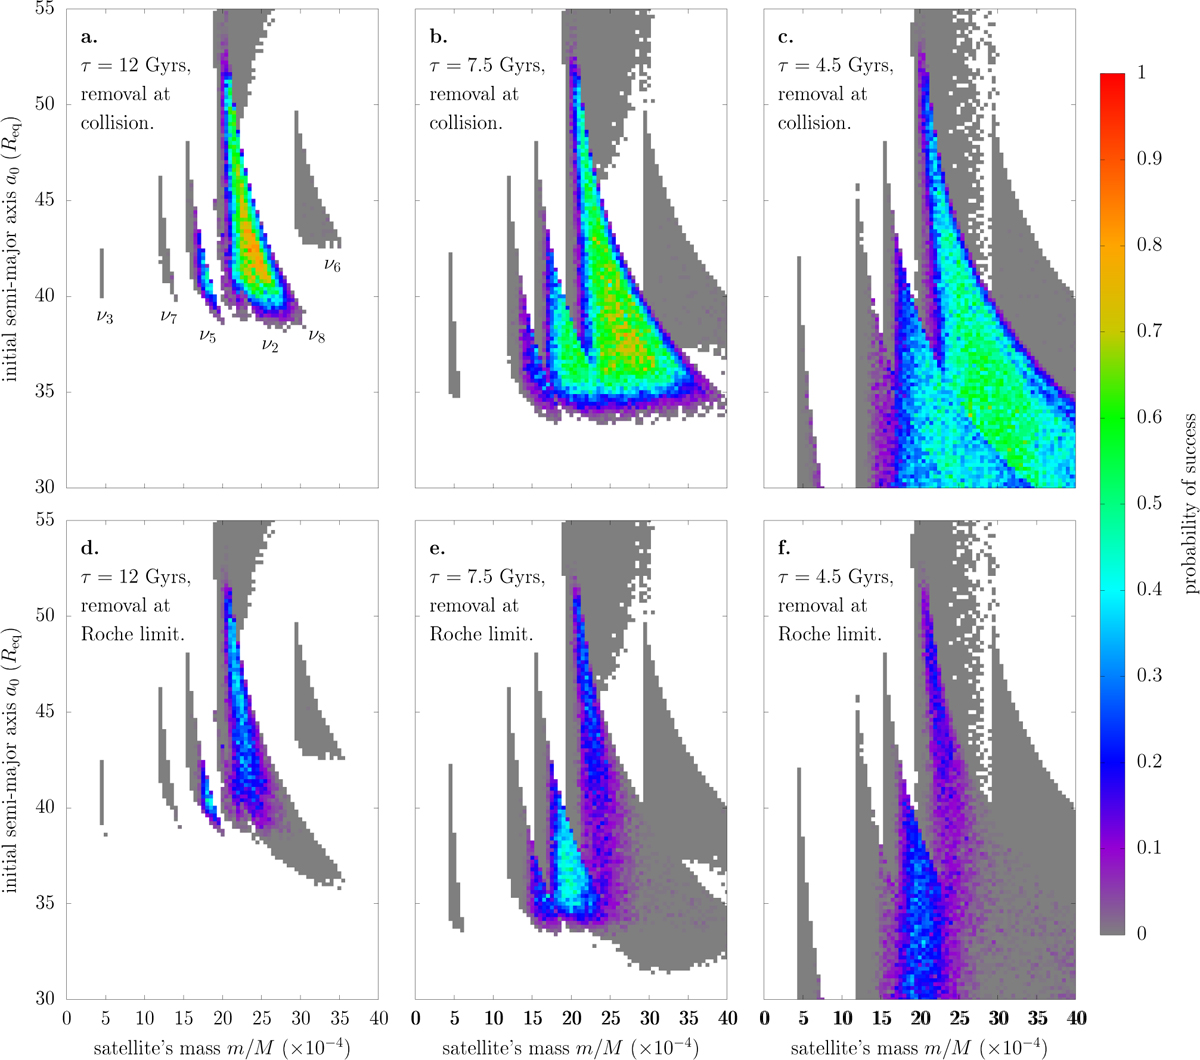
Download original image
Probability of destructing the satellite and producing a retrograde obliquity as a function of the mass of the satellite (bottom axis), its initial semi-major axis (vertical axis), and its migration timescale (labels). Each pixel features 96 numerical integrations over 4 Gyr with random initial angles (same setting as in Fig. 10). In the upper panels, the satellite is removed when it collides into the planet (q < Req). In the lower panels, the satellite is removed when it goes below the Roche limit (q < 2 Req). White pixels mean that the satellite survived in all 96 simulations. Coloured pixels show the fraction of simulations in which the satellite is destructed and the planet’s spin axis ends in the retrograde family. Resonances are labelled in panel a.
Current usage metrics show cumulative count of Article Views (full-text article views including HTML views, PDF and ePub downloads, according to the available data) and Abstracts Views on Vision4Press platform.
Data correspond to usage on the plateform after 2015. The current usage metrics is available 48-96 hours after online publication and is updated daily on week days.
Initial download of the metrics may take a while.