Fig. 11

Download original image
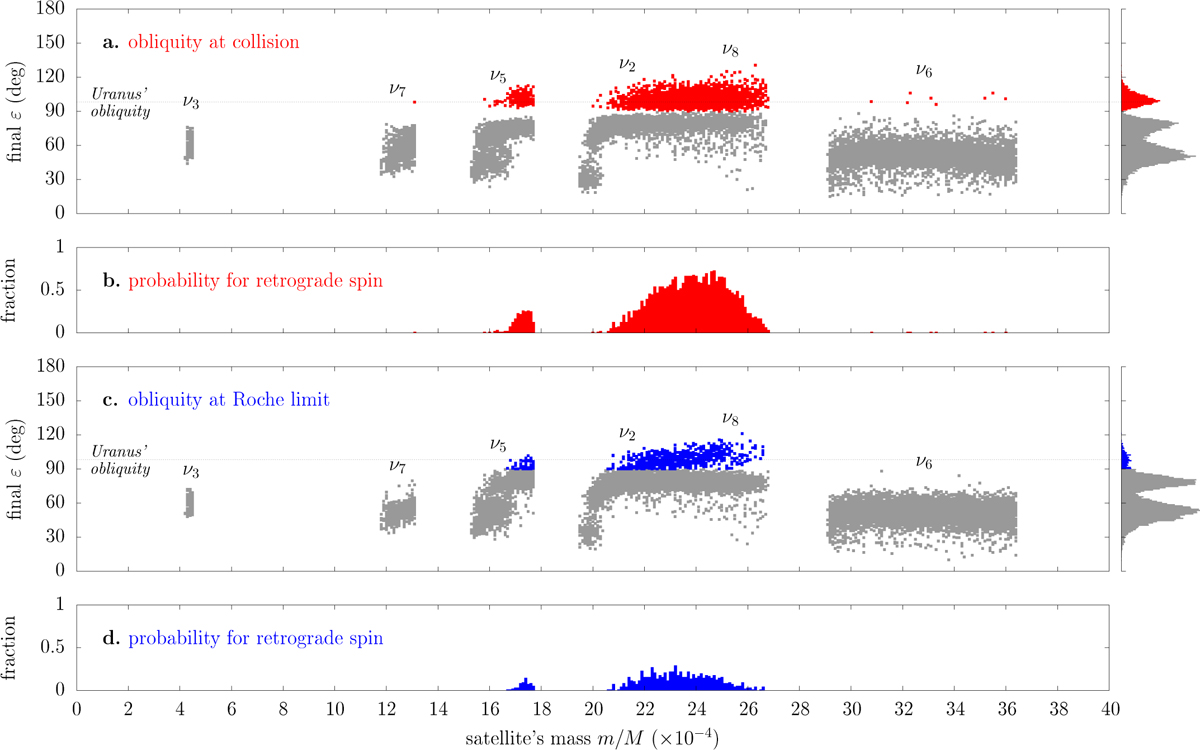
Final value of the planet’s obliquity in the simulations of Fig. 10. Panels a and b: the satellite is removed when it collides into the planet. Trajectories in which the satellite does not collide within the integration timespan are not shown. The main resonances are labelled. The obliquity histogram is given on the right. Obliquity values larger than 90° are highlighted in red; their ratio over all trajectories (including those without collision) is shown in panel b as a function of mass. Panels c and d: the satellite is removed when it goes below the Roche limit. Trajectories in which it never does are not shown. Obliquity values larger than 90° are highlighted in blue.
Current usage metrics show cumulative count of Article Views (full-text article views including HTML views, PDF and ePub downloads, according to the available data) and Abstracts Views on Vision4Press platform.
Data correspond to usage on the plateform after 2015. The current usage metrics is available 48-96 hours after online publication and is updated daily on week days.
Initial download of the metrics may take a while.


