Fig. 10
Download original image
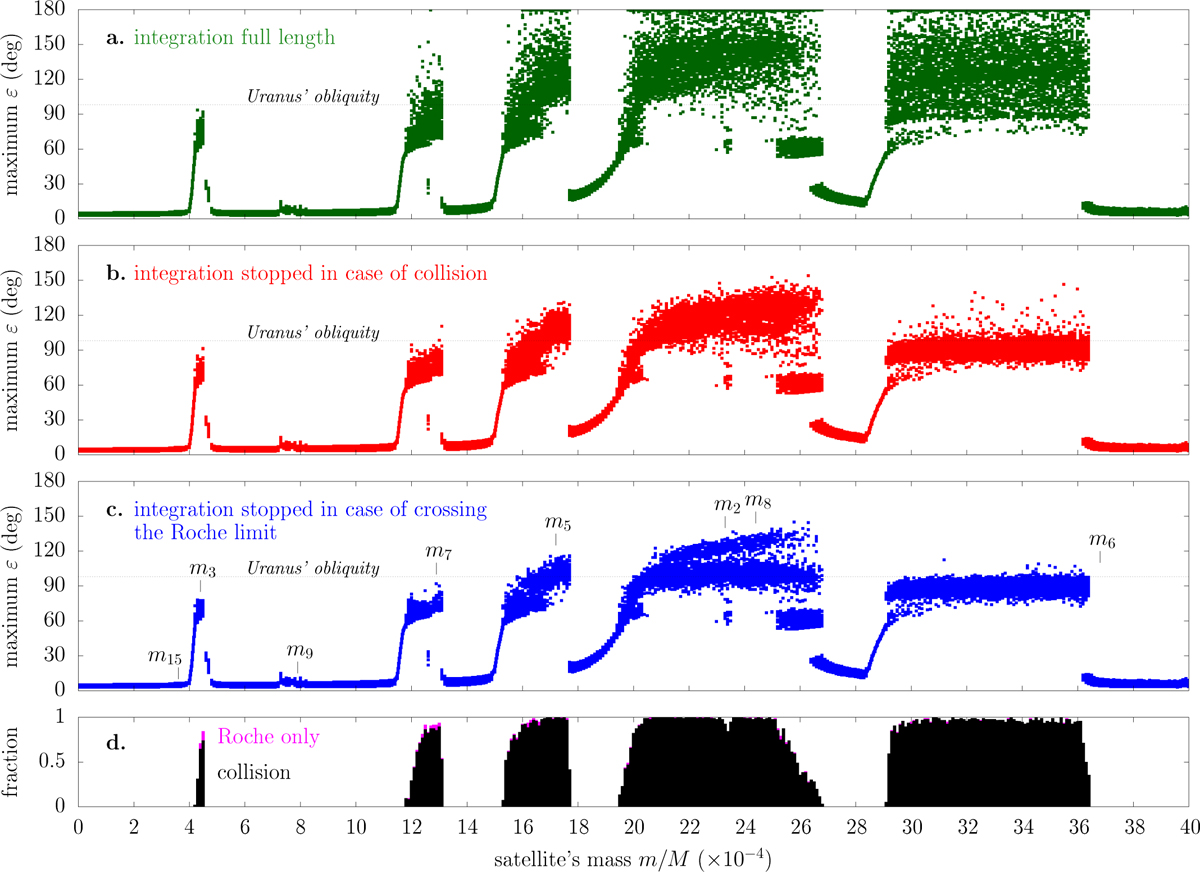
Maximum obliquity reached in the course of numerical integrations using a fully coupled secular model. For each value of the satellite’s mass (bottom axis), 96 numerical integrations are performed with random initial conditions as described in the text. The initial semi-major axis of the satellite is a0 = 42 Req and it is made migrating according to Eq. (9) with timescale τ = 7.5 Gyr. Panel a: the maximum obliquity reached over a full duration of 4 Gyr is shown by a small dot. The horizontal dotted line shows Uranus’s current obliquity. Panel b: same as panel a, except that integrations are stopped if the satellite collides into the planet. If a collision occurs, the dot on the graph shows the maximum obliquity reached before the collision; the time of reaching this maximum may be different from the collision time. Panel c: same as panel b, except that integrations are stopped if the satellite goes below the Roche limit (taken equal to 2 Req). The mass estimates from Table 2 are labelled (small vertical lines). Panel d: histogram showing the fraction of trajectories featuring a collision (black). The magenta bars on top show the small fraction of trajectories for which the satellite goes below the Roche limit but does not collide into the planet within the integration timespan.
Current usage metrics show cumulative count of Article Views (full-text article views including HTML views, PDF and ePub downloads, according to the available data) and Abstracts Views on Vision4Press platform.
Data correspond to usage on the plateform after 2015. The current usage metrics is available 48-96 hours after online publication and is updated daily on week days.
Initial download of the metrics may take a while.