Fig. 1
Download original image
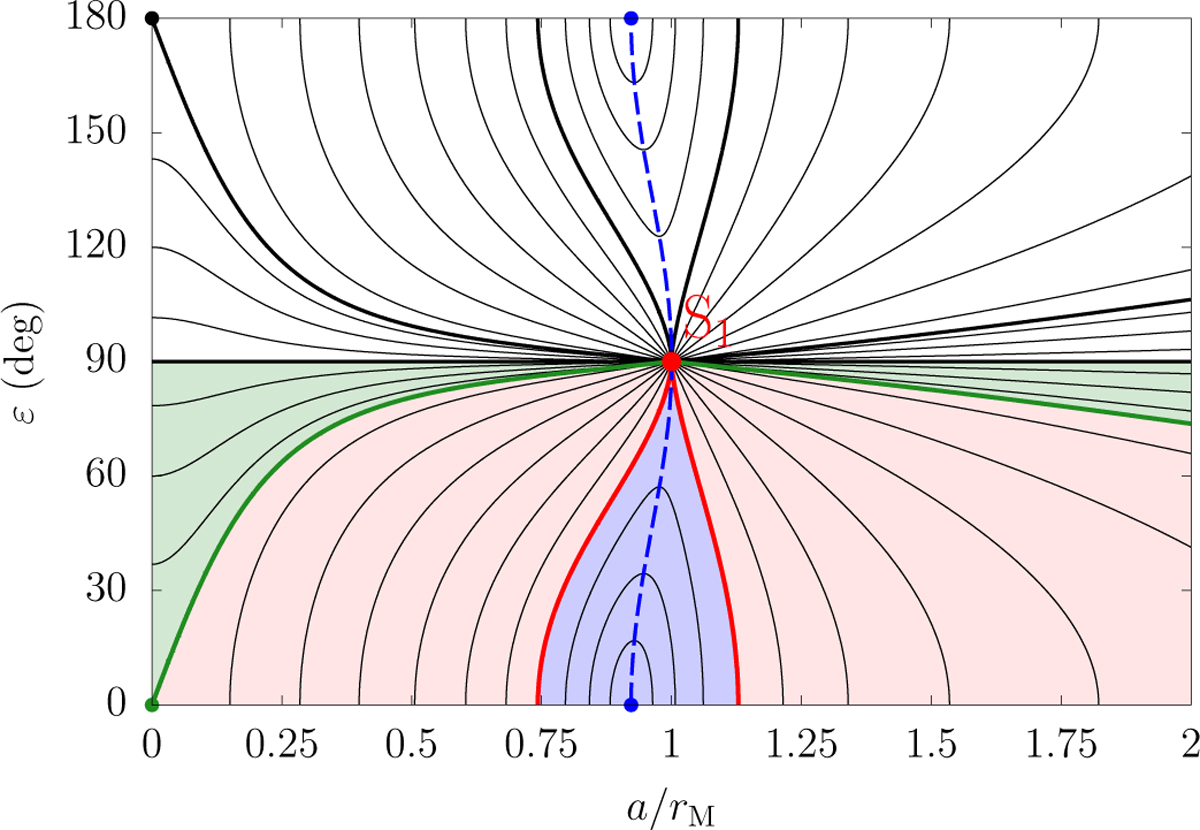
Level curves of the spin-axis precession rate of the planet as a function of its obliquity and the distance of its satellite. The simplified formula in Eq. (3) is used here with η = 20. Curves in the pink region connect ε = 0° to S1. Curves in the blue region connect ε = 0° to ε = 0° again. Curves in the green region never go to ε = 0° but they connect to S1. The mirror level curves exist for ε > 90° with reversed precession motion. The precession rate along the red level is Ω0 = pη/2. The precession rate along the dark green level is Ω0 = p; it connects (a, ε) = (0, 0°) to S1. The dashed blue curve is the ridge line separating the close and far satellite regimes; it has expression ![]() . See Fig. 17 of Saillenfest & Lari (2021) for examples with other values of η.
. See Fig. 17 of Saillenfest & Lari (2021) for examples with other values of η.
Current usage metrics show cumulative count of Article Views (full-text article views including HTML views, PDF and ePub downloads, according to the available data) and Abstracts Views on Vision4Press platform.
Data correspond to usage on the plateform after 2015. The current usage metrics is available 48-96 hours after online publication and is updated daily on week days.
Initial download of the metrics may take a while.