Fig. 6
Download original image
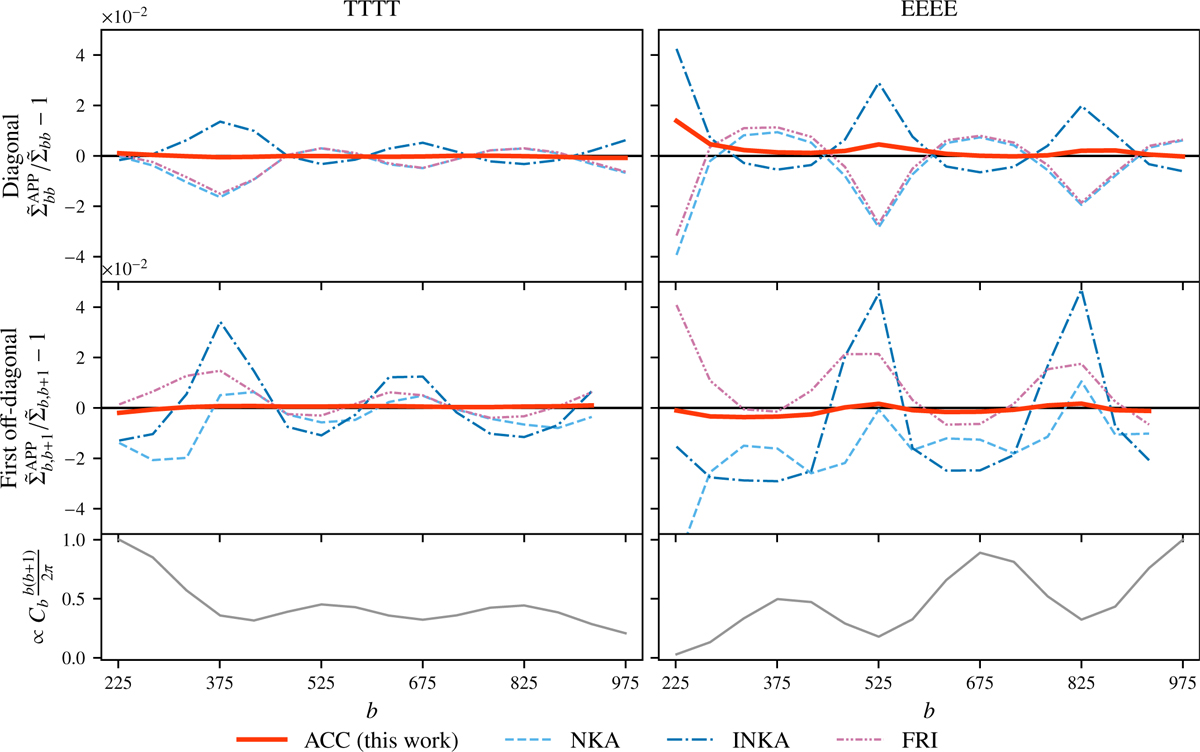
Relative differences of binned approximations with respect to the exact binned covariance: ![]() for TTTT (left) and EEEE (right), with binning Δℓ = 50. In the first row, we plot the relative differences for the diagonal, i.e., b = b′, while in the second row, we plot those of the first off-diagonal, i.e., b′ = b + 1. The NKA (light blue dashed), FRI (purple dashed-double-dot) and INKA (dark blue dashed-dot) approximations are accurate at the 5% level, whereas the ACC approximation (solid red) reaches the 1% level, both in intensity and polarization for multipoles larger than ℓcut = 200. The relative differences are plotted for bins that include multipoles up to ℓmax,ex = 1000 because it is the maximum multipole for which we computed all the rows of the exact covariance. The third row displays the corresponding binned underlying renormalized spectrum TT or EE to show that the difference of the covariances lies in the peaks and troughs of the spectra.
for TTTT (left) and EEEE (right), with binning Δℓ = 50. In the first row, we plot the relative differences for the diagonal, i.e., b = b′, while in the second row, we plot those of the first off-diagonal, i.e., b′ = b + 1. The NKA (light blue dashed), FRI (purple dashed-double-dot) and INKA (dark blue dashed-dot) approximations are accurate at the 5% level, whereas the ACC approximation (solid red) reaches the 1% level, both in intensity and polarization for multipoles larger than ℓcut = 200. The relative differences are plotted for bins that include multipoles up to ℓmax,ex = 1000 because it is the maximum multipole for which we computed all the rows of the exact covariance. The third row displays the corresponding binned underlying renormalized spectrum TT or EE to show that the difference of the covariances lies in the peaks and troughs of the spectra.
Current usage metrics show cumulative count of Article Views (full-text article views including HTML views, PDF and ePub downloads, according to the available data) and Abstracts Views on Vision4Press platform.
Data correspond to usage on the plateform after 2015. The current usage metrics is available 48-96 hours after online publication and is updated daily on week days.
Initial download of the metrics may take a while.