Fig. 1

Download original image
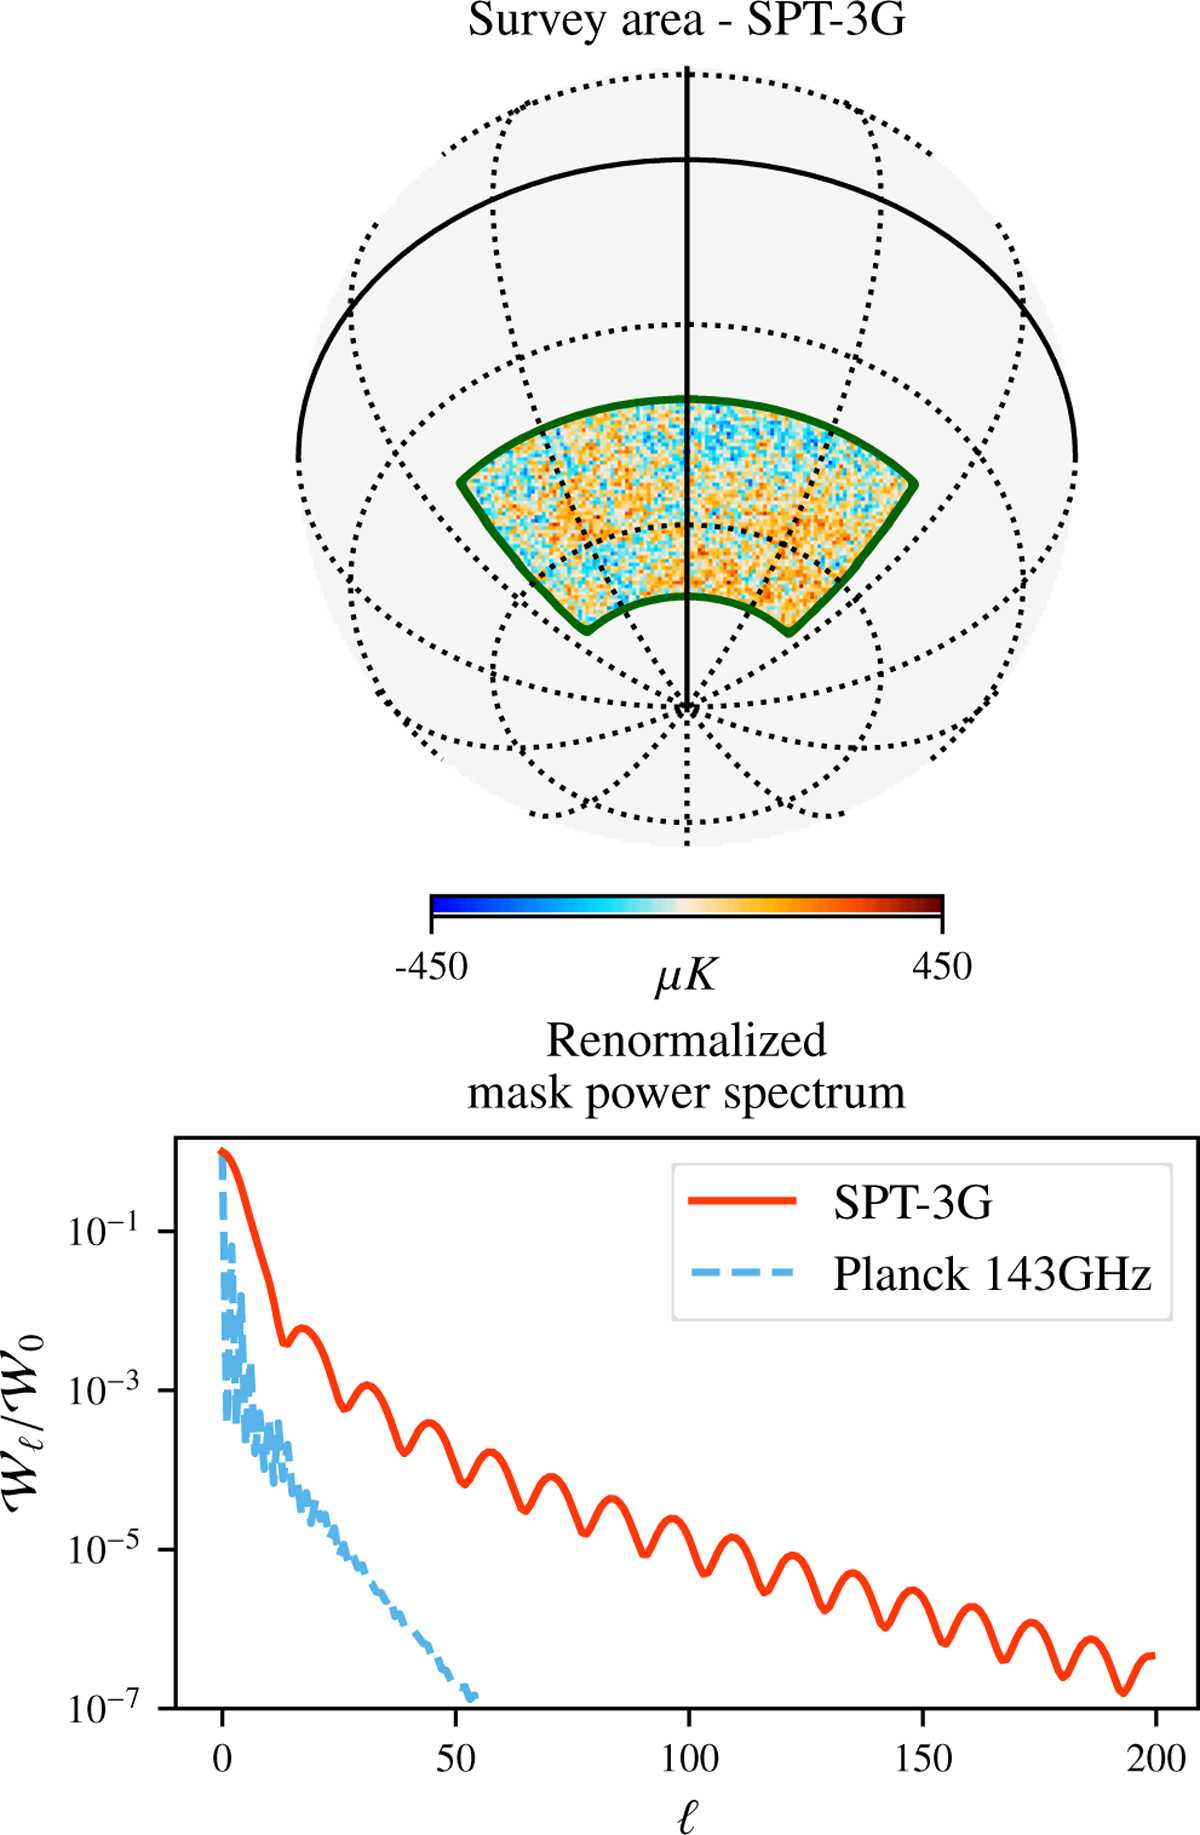
Survey area and the mask power spectrum. Top panel: CMB temperature anisotropies on the SPT-3G patch in galactic coordinates. The dark green line delimits the survey footprint. The vertical and horizontal bold black lines are the zero-longitude and zero-latitude coordinates, respectively. The SPT-3G patch covers roughly 4% of the sky. Bottom panel: mask power spectra as defined in Eq. (A.4) for SPT-3G and for the 143 GHz map used in the Planck cosmological analysis, which covers around 70% of the sky. The spectra have been renormalized by their first value for comparison purposes. Masks corresponding to small sky fractions, such as that of SPT-3G, have a shallower power spectrum than large ones. We emphasize that the mask used here does not include point-source masking.
Current usage metrics show cumulative count of Article Views (full-text article views including HTML views, PDF and ePub downloads, according to the available data) and Abstracts Views on Vision4Press platform.
Data correspond to usage on the plateform after 2015. The current usage metrics is available 48-96 hours after online publication and is updated daily on week days.
Initial download of the metrics may take a while.


