Fig. A.1.
Download original image
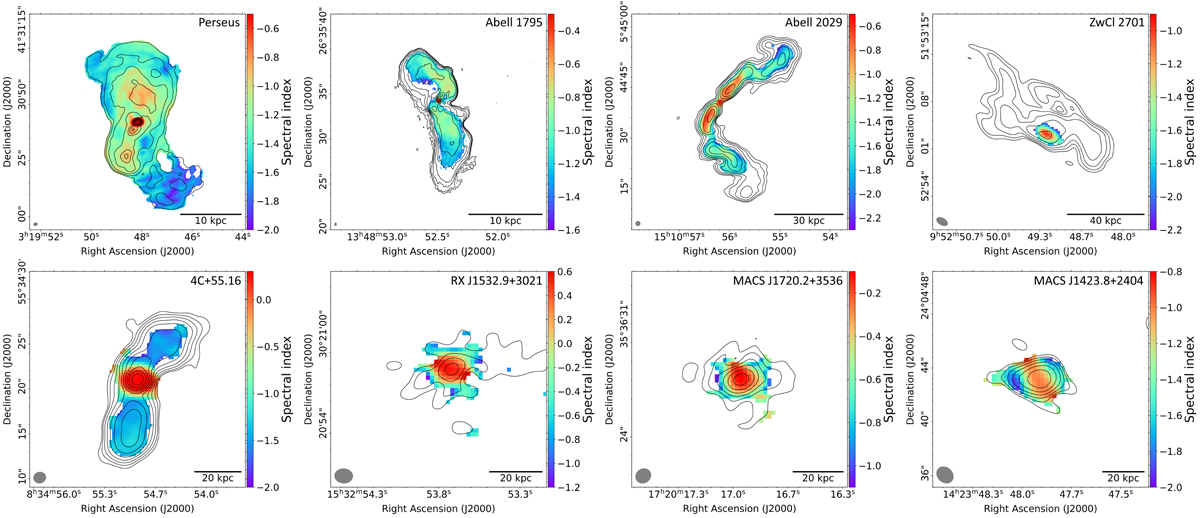
Spectral index maps of the high-resolution sample based on LOFAR and VLA observations. The spectral index for all targets is calculated between 144 MHz and 1.5 GHz, except for Abell 1795, for which the spectral index is calculated between 144 MHz and 8 GHz. All spectral index maps are masked below 3σ confidence. The black contours indicate the radio intensity at 144 MHz and are drawn in increments of 2, starting at 5 times the rms noise level. The beam is indicated in gray in the bottom left corner of each panel.
Current usage metrics show cumulative count of Article Views (full-text article views including HTML views, PDF and ePub downloads, according to the available data) and Abstracts Views on Vision4Press platform.
Data correspond to usage on the plateform after 2015. The current usage metrics is available 48-96 hours after online publication and is updated daily on week days.
Initial download of the metrics may take a while.