Fig. 3.
Download original image
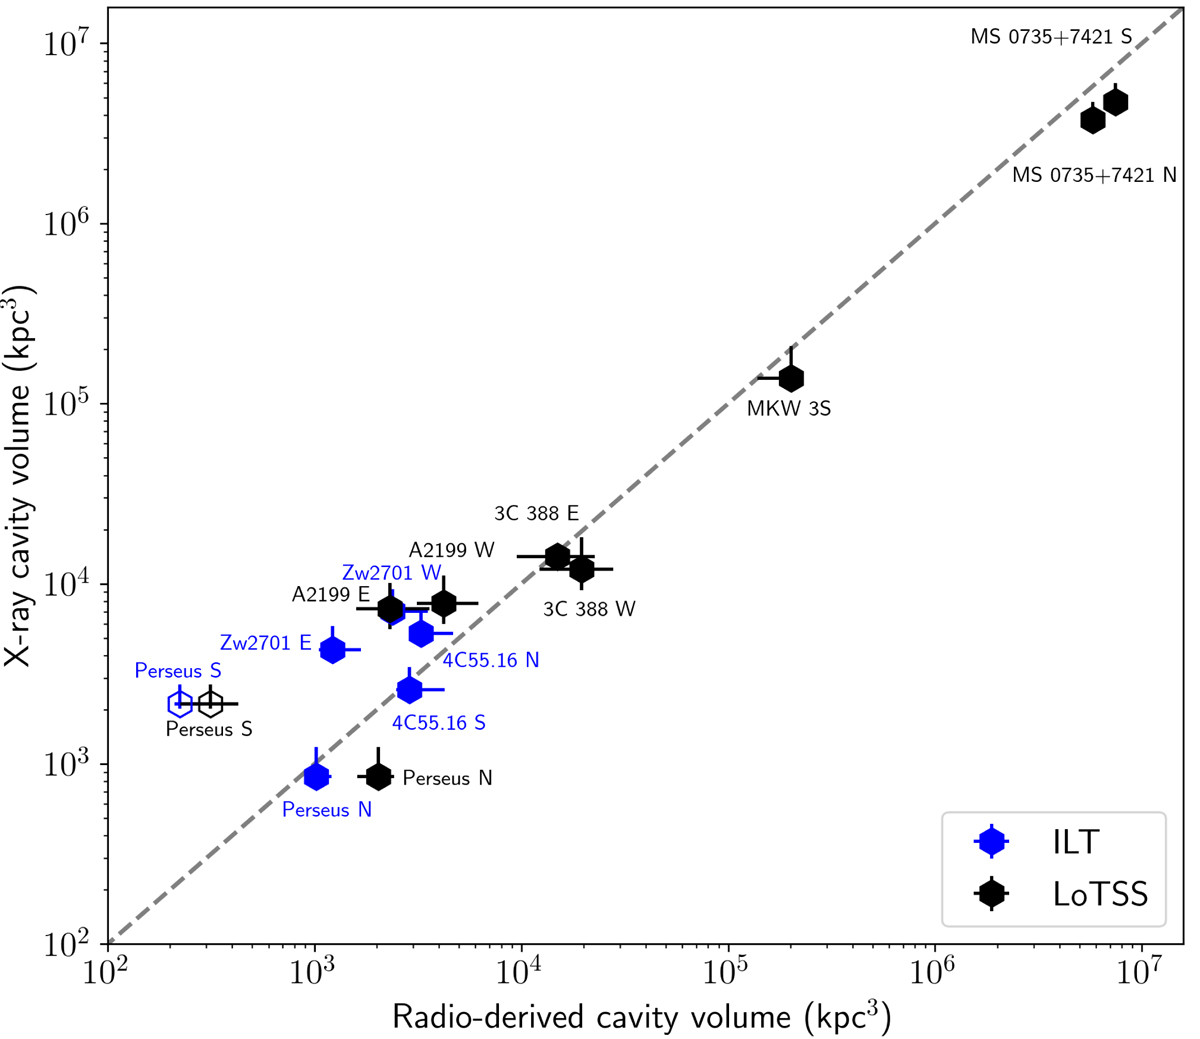
Radio-estimated cavity volumes versus X-ray-estimated cavity volumes. The blue data points indicate the measurements derived using high-resolution observations, while the black data points indicate the measurements derived using low-resolution observations. The dashed line indicates the line of equality. The open markers indicate the cavities for which the radio lobe does not visually match the cavity as observed in the X-ray.
Current usage metrics show cumulative count of Article Views (full-text article views including HTML views, PDF and ePub downloads, according to the available data) and Abstracts Views on Vision4Press platform.
Data correspond to usage on the plateform after 2015. The current usage metrics is available 48-96 hours after online publication and is updated daily on week days.
Initial download of the metrics may take a while.